Immigrants from Egypt vs Dutch Associate's Degree
COMPARE
Immigrants from Egypt
Dutch
Associate's Degree
Associate's Degree Comparison
Immigrants from Egypt
Dutch
50.2%
ASSOCIATE'S DEGREE
98.9/ 100
METRIC RATING
85th/ 347
METRIC RANK
45.0%
ASSOCIATE'S DEGREE
17.6/ 100
METRIC RATING
208th/ 347
METRIC RANK
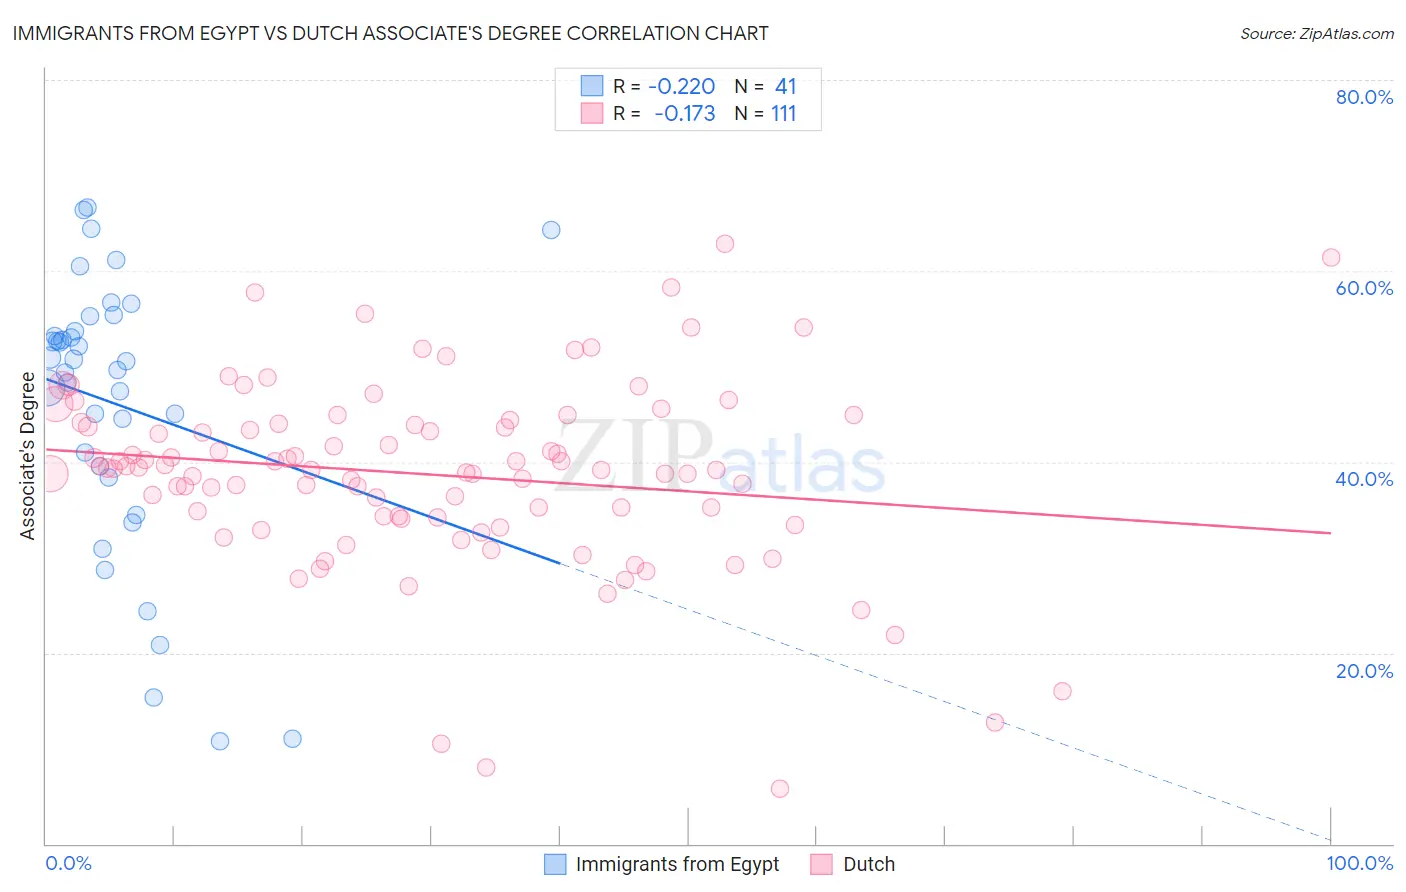
Immigrants from Egypt vs Dutch Associate's Degree Correlation Chart
The statistical analysis conducted on geographies consisting of 245,484,715 people shows a weak negative correlation between the proportion of Immigrants from Egypt and percentage of population with at least associate's degree education in the United States with a correlation coefficient (R) of -0.220 and weighted average of 50.2%. Similarly, the statistical analysis conducted on geographies consisting of 554,303,410 people shows a poor negative correlation between the proportion of Dutch and percentage of population with at least associate's degree education in the United States with a correlation coefficient (R) of -0.173 and weighted average of 45.0%, a difference of 11.6%.
Associate's Degree Correlation Summary
| Measurement | Immigrants from Egypt | Dutch |
| Minimum | 10.8% | 5.7% |
| Maximum | 66.7% | 62.9% |
| Range | 55.9% | 57.2% |
| Mean | 46.0% | 38.7% |
| Median | 50.5% | 39.3% |
| Interquartile 25% (IQ1) | 38.9% | 34.2% |
| Interquartile 75% (IQ3) | 54.4% | 43.9% |
| Interquartile Range (IQR) | 15.5% | 9.8% |
| Standard Deviation (Sample) | 14.4% | 9.9% |
| Standard Deviation (Population) | 14.2% | 9.8% |
Similar Demographics by Associate's Degree
Demographics Similar to Immigrants from Egypt by Associate's Degree
In terms of associate's degree, the demographic groups most similar to Immigrants from Egypt are Immigrants from Croatia (50.2%, a difference of 0.010%), Immigrants from Hungary (50.2%, a difference of 0.050%), Immigrants from Uzbekistan (50.3%, a difference of 0.070%), Greek (50.3%, a difference of 0.11%), and Immigrants from Moldova (50.2%, a difference of 0.13%).
| Demographics | Rating | Rank | Associate's Degree |
| Immigrants | Eastern Europe | 99.1 /100 | #78 | Exceptional 50.5% |
| Ethiopians | 99.1 /100 | #79 | Exceptional 50.4% |
| Armenians | 99.1 /100 | #80 | Exceptional 50.4% |
| Maltese | 99.1 /100 | #81 | Exceptional 50.4% |
| Greeks | 98.9 /100 | #82 | Exceptional 50.3% |
| Immigrants | Uzbekistan | 98.9 /100 | #83 | Exceptional 50.3% |
| Immigrants | Hungary | 98.9 /100 | #84 | Exceptional 50.2% |
| Immigrants | Egypt | 98.9 /100 | #85 | Exceptional 50.2% |
| Immigrants | Croatia | 98.9 /100 | #86 | Exceptional 50.2% |
| Immigrants | Moldova | 98.8 /100 | #87 | Exceptional 50.2% |
| Immigrants | Canada | 98.7 /100 | #88 | Exceptional 50.1% |
| Immigrants | Western Europe | 98.7 /100 | #89 | Exceptional 50.1% |
| Immigrants | Ethiopia | 98.7 /100 | #90 | Exceptional 50.1% |
| Immigrants | Western Asia | 98.7 /100 | #91 | Exceptional 50.1% |
| Immigrants | North America | 98.7 /100 | #92 | Exceptional 50.1% |
Demographics Similar to Dutch by Associate's Degree
In terms of associate's degree, the demographic groups most similar to Dutch are Panamanian (45.1%, a difference of 0.10%), Immigrants from Costa Rica (45.0%, a difference of 0.11%), Immigrants from Philippines (45.0%, a difference of 0.12%), Immigrants from Zaire (45.0%, a difference of 0.13%), and Immigrants from Thailand (45.1%, a difference of 0.17%).
| Demographics | Rating | Rank | Associate's Degree |
| Immigrants | Vietnam | 20.8 /100 | #201 | Fair 45.2% |
| Spaniards | 20.4 /100 | #202 | Fair 45.2% |
| Immigrants | South Eastern Asia | 20.2 /100 | #203 | Fair 45.2% |
| Nigerians | 19.1 /100 | #204 | Poor 45.1% |
| Immigrants | Thailand | 18.9 /100 | #205 | Poor 45.1% |
| German Russians | 18.9 /100 | #206 | Poor 45.1% |
| Panamanians | 18.4 /100 | #207 | Poor 45.1% |
| Dutch | 17.6 /100 | #208 | Poor 45.0% |
| Immigrants | Costa Rica | 16.7 /100 | #209 | Poor 45.0% |
| Immigrants | Philippines | 16.7 /100 | #210 | Poor 45.0% |
| Immigrants | Zaire | 16.6 /100 | #211 | Poor 45.0% |
| French Canadians | 15.0 /100 | #212 | Poor 44.9% |
| Immigrants | Ghana | 14.2 /100 | #213 | Poor 44.8% |
| Immigrants | Middle Africa | 12.7 /100 | #214 | Poor 44.7% |
| Immigrants | Panama | 12.4 /100 | #215 | Poor 44.7% |