Immigrants from Egypt vs Cambodian 3rd Grade
COMPARE
Immigrants from Egypt
Cambodian
3rd Grade
3rd Grade Comparison
Immigrants from Egypt
Cambodians
97.7%
3RD GRADE
26.8/ 100
METRIC RATING
195th/ 347
METRIC RANK
97.9%
3RD GRADE
88.1/ 100
METRIC RATING
135th/ 347
METRIC RANK
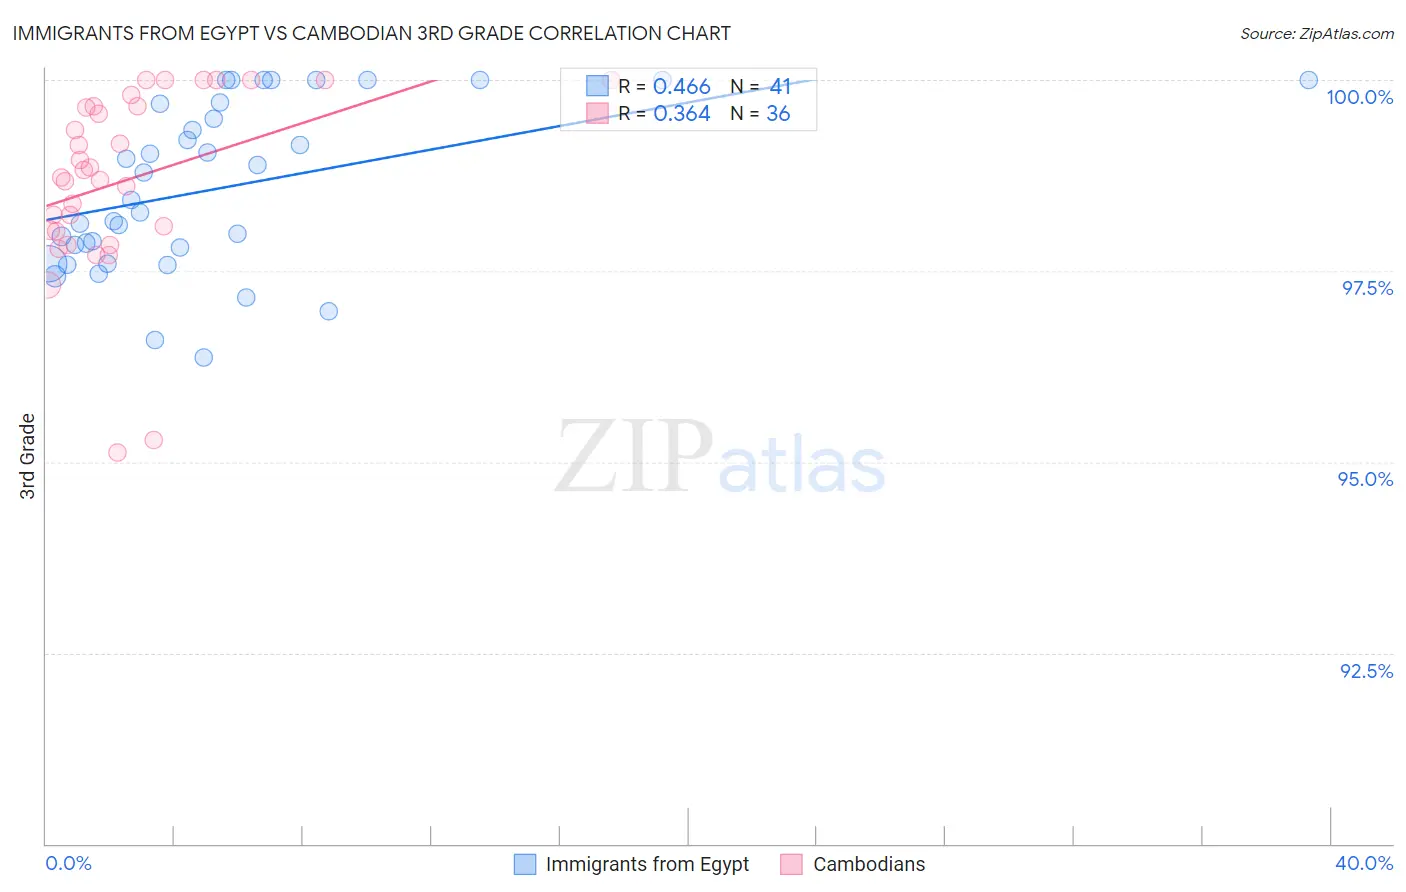
Immigrants from Egypt vs Cambodian 3rd Grade Correlation Chart
The statistical analysis conducted on geographies consisting of 245,485,794 people shows a moderate positive correlation between the proportion of Immigrants from Egypt and percentage of population with at least 3rd grade education in the United States with a correlation coefficient (R) of 0.466 and weighted average of 97.7%. Similarly, the statistical analysis conducted on geographies consisting of 102,511,743 people shows a mild positive correlation between the proportion of Cambodians and percentage of population with at least 3rd grade education in the United States with a correlation coefficient (R) of 0.364 and weighted average of 97.9%, a difference of 0.25%.
3rd Grade Correlation Summary
| Measurement | Immigrants from Egypt | Cambodian |
| Minimum | 96.4% | 95.1% |
| Maximum | 100.0% | 100.0% |
| Range | 3.6% | 4.9% |
| Mean | 98.6% | 98.7% |
| Median | 98.4% | 98.8% |
| Interquartile 25% (IQ1) | 97.7% | 98.0% |
| Interquartile 75% (IQ3) | 99.7% | 99.7% |
| Interquartile Range (IQR) | 2.0% | 1.6% |
| Standard Deviation (Sample) | 1.1% | 1.2% |
| Standard Deviation (Population) | 1.1% | 1.2% |
Similar Demographics by 3rd Grade
Demographics Similar to Immigrants from Egypt by 3rd Grade
In terms of 3rd grade, the demographic groups most similar to Immigrants from Egypt are Immigrants from Uganda (97.7%, a difference of 0.0%), Paraguayan (97.7%, a difference of 0.0%), Hawaiian (97.7%, a difference of 0.0%), Black/African American (97.7%, a difference of 0.010%), and Mongolian (97.7%, a difference of 0.010%).
| Demographics | Rating | Rank | 3rd Grade |
| Immigrants | Taiwan | 34.2 /100 | #188 | Fair 97.7% |
| Pakistanis | 34.2 /100 | #189 | Fair 97.7% |
| Panamanians | 31.5 /100 | #190 | Fair 97.7% |
| Blacks/African Americans | 29.6 /100 | #191 | Fair 97.7% |
| Mongolians | 29.1 /100 | #192 | Fair 97.7% |
| Immigrants | Kenya | 28.2 /100 | #193 | Fair 97.7% |
| Immigrants | Uganda | 27.4 /100 | #194 | Fair 97.7% |
| Immigrants | Egypt | 26.8 /100 | #195 | Fair 97.7% |
| Paraguayans | 26.2 /100 | #196 | Fair 97.7% |
| Hawaiians | 25.7 /100 | #197 | Fair 97.7% |
| Guamanians/Chamorros | 23.6 /100 | #198 | Fair 97.7% |
| Immigrants | Ukraine | 22.7 /100 | #199 | Fair 97.7% |
| Immigrants | Albania | 22.6 /100 | #200 | Fair 97.7% |
| Immigrants | Lebanon | 21.7 /100 | #201 | Fair 97.7% |
| Immigrants | Southern Europe | 17.7 /100 | #202 | Poor 97.6% |
Demographics Similar to Cambodians by 3rd Grade
In terms of 3rd grade, the demographic groups most similar to Cambodians are Immigrants from Kuwait (97.9%, a difference of 0.0%), Seminole (97.9%, a difference of 0.0%), Spaniard (97.9%, a difference of 0.0%), Immigrants from Romania (97.9%, a difference of 0.0%), and Immigrants from Bulgaria (97.9%, a difference of 0.010%).
| Demographics | Rating | Rank | 3rd Grade |
| Colville | 92.1 /100 | #128 | Exceptional 98.0% |
| Immigrants | Serbia | 91.9 /100 | #129 | Exceptional 98.0% |
| Immigrants | Europe | 91.2 /100 | #130 | Exceptional 98.0% |
| Immigrants | Bulgaria | 89.1 /100 | #131 | Excellent 97.9% |
| Immigrants | Hungary | 88.8 /100 | #132 | Excellent 97.9% |
| Immigrants | Kuwait | 88.7 /100 | #133 | Excellent 97.9% |
| Seminole | 88.7 /100 | #134 | Excellent 97.9% |
| Cambodians | 88.1 /100 | #135 | Excellent 97.9% |
| Spaniards | 87.9 /100 | #136 | Excellent 97.9% |
| Immigrants | Romania | 87.9 /100 | #137 | Excellent 97.9% |
| Israelis | 86.6 /100 | #138 | Excellent 97.9% |
| Blackfeet | 86.3 /100 | #139 | Excellent 97.9% |
| Palestinians | 84.6 /100 | #140 | Excellent 97.9% |
| Immigrants | Turkey | 83.5 /100 | #141 | Excellent 97.9% |
| Hmong | 80.3 /100 | #142 | Excellent 97.9% |