Immigrants from Egypt vs Arab Master's Degree
COMPARE
Immigrants from Egypt
Arab
Master's Degree
Master's Degree Comparison
Immigrants from Egypt
Arabs
17.2%
MASTER'S DEGREE
99.1/ 100
METRIC RATING
90th/ 347
METRIC RANK
16.7%
MASTER'S DEGREE
97.7/ 100
METRIC RATING
113th/ 347
METRIC RANK
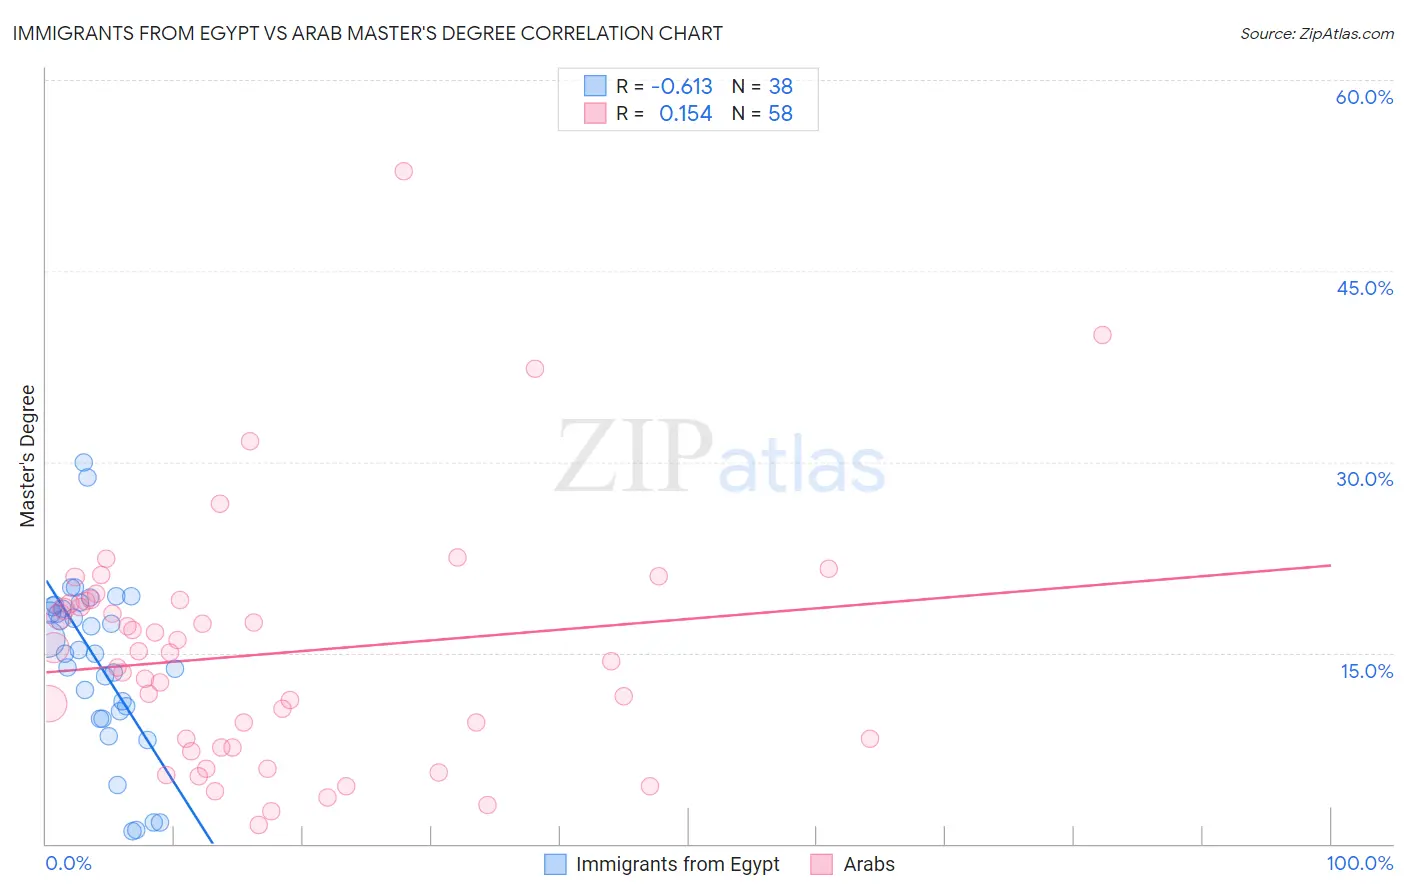
Immigrants from Egypt vs Arab Master's Degree Correlation Chart
The statistical analysis conducted on geographies consisting of 245,464,462 people shows a significant negative correlation between the proportion of Immigrants from Egypt and percentage of population with at least master's degree education in the United States with a correlation coefficient (R) of -0.613 and weighted average of 17.2%. Similarly, the statistical analysis conducted on geographies consisting of 486,607,303 people shows a poor positive correlation between the proportion of Arabs and percentage of population with at least master's degree education in the United States with a correlation coefficient (R) of 0.154 and weighted average of 16.7%, a difference of 2.9%.
Master's Degree Correlation Summary
| Measurement | Immigrants from Egypt | Arab |
| Minimum | 1.0% | 1.5% |
| Maximum | 29.9% | 52.8% |
| Range | 28.9% | 51.4% |
| Mean | 14.3% | 14.9% |
| Median | 15.1% | 14.7% |
| Interquartile 25% (IQ1) | 10.4% | 7.6% |
| Interquartile 75% (IQ3) | 18.7% | 19.1% |
| Interquartile Range (IQR) | 8.2% | 11.5% |
| Standard Deviation (Sample) | 6.7% | 9.5% |
| Standard Deviation (Population) | 6.6% | 9.5% |
Similar Demographics by Master's Degree
Demographics Similar to Immigrants from Egypt by Master's Degree
In terms of master's degree, the demographic groups most similar to Immigrants from Egypt are Bhutanese (17.2%, a difference of 0.020%), Romanian (17.2%, a difference of 0.070%), Immigrants from Canada (17.2%, a difference of 0.090%), Immigrants from North America (17.2%, a difference of 0.12%), and Immigrants from Italy (17.2%, a difference of 0.18%).
| Demographics | Rating | Rank | Master's Degree |
| Immigrants | Zimbabwe | 99.5 /100 | #83 | Exceptional 17.4% |
| Immigrants | Scotland | 99.4 /100 | #84 | Exceptional 17.4% |
| Immigrants | Brazil | 99.4 /100 | #85 | Exceptional 17.4% |
| Immigrants | Croatia | 99.3 /100 | #86 | Exceptional 17.3% |
| Maltese | 99.3 /100 | #87 | Exceptional 17.3% |
| Immigrants | Canada | 99.2 /100 | #88 | Exceptional 17.2% |
| Bhutanese | 99.1 /100 | #89 | Exceptional 17.2% |
| Immigrants | Egypt | 99.1 /100 | #90 | Exceptional 17.2% |
| Romanians | 99.1 /100 | #91 | Exceptional 17.2% |
| Immigrants | North America | 99.1 /100 | #92 | Exceptional 17.2% |
| Immigrants | Italy | 99.1 /100 | #93 | Exceptional 17.2% |
| Ugandans | 99.0 /100 | #94 | Exceptional 17.1% |
| Immigrants | Morocco | 98.9 /100 | #95 | Exceptional 17.1% |
| Immigrants | Northern Africa | 98.9 /100 | #96 | Exceptional 17.1% |
| Immigrants | England | 98.8 /100 | #97 | Exceptional 17.0% |
Demographics Similar to Arabs by Master's Degree
In terms of master's degree, the demographic groups most similar to Arabs are Macedonian (16.7%, a difference of 0.010%), Northern European (16.7%, a difference of 0.070%), Austrian (16.7%, a difference of 0.15%), Immigrants from Uganda (16.6%, a difference of 0.37%), and Immigrants from Chile (16.8%, a difference of 0.42%).
| Demographics | Rating | Rank | Master's Degree |
| Immigrants | Albania | 98.1 /100 | #106 | Exceptional 16.8% |
| Armenians | 98.0 /100 | #107 | Exceptional 16.8% |
| Sierra Leoneans | 98.0 /100 | #108 | Exceptional 16.8% |
| Moroccans | 98.0 /100 | #109 | Exceptional 16.8% |
| Immigrants | Chile | 98.0 /100 | #110 | Exceptional 16.8% |
| Austrians | 97.8 /100 | #111 | Exceptional 16.7% |
| Macedonians | 97.7 /100 | #112 | Exceptional 16.7% |
| Arabs | 97.7 /100 | #113 | Exceptional 16.7% |
| Northern Europeans | 97.6 /100 | #114 | Exceptional 16.7% |
| Immigrants | Uganda | 97.3 /100 | #115 | Exceptional 16.6% |
| Immigrants | Southern Europe | 97.2 /100 | #116 | Exceptional 16.6% |
| Immigrants | Moldova | 97.2 /100 | #117 | Exceptional 16.6% |
| Brazilians | 96.8 /100 | #118 | Exceptional 16.5% |
| Jordanians | 96.5 /100 | #119 | Exceptional 16.5% |
| Lebanese | 96.4 /100 | #120 | Exceptional 16.5% |