Immigrants from Ecuador vs Pakistani 11th Grade
COMPARE
Immigrants from Ecuador
Pakistani
11th Grade
11th Grade Comparison
Immigrants from Ecuador
Pakistanis
89.1%
11TH GRADE
0.0/ 100
METRIC RATING
315th/ 347
METRIC RANK
92.8%
11TH GRADE
79.6/ 100
METRIC RATING
145th/ 347
METRIC RANK
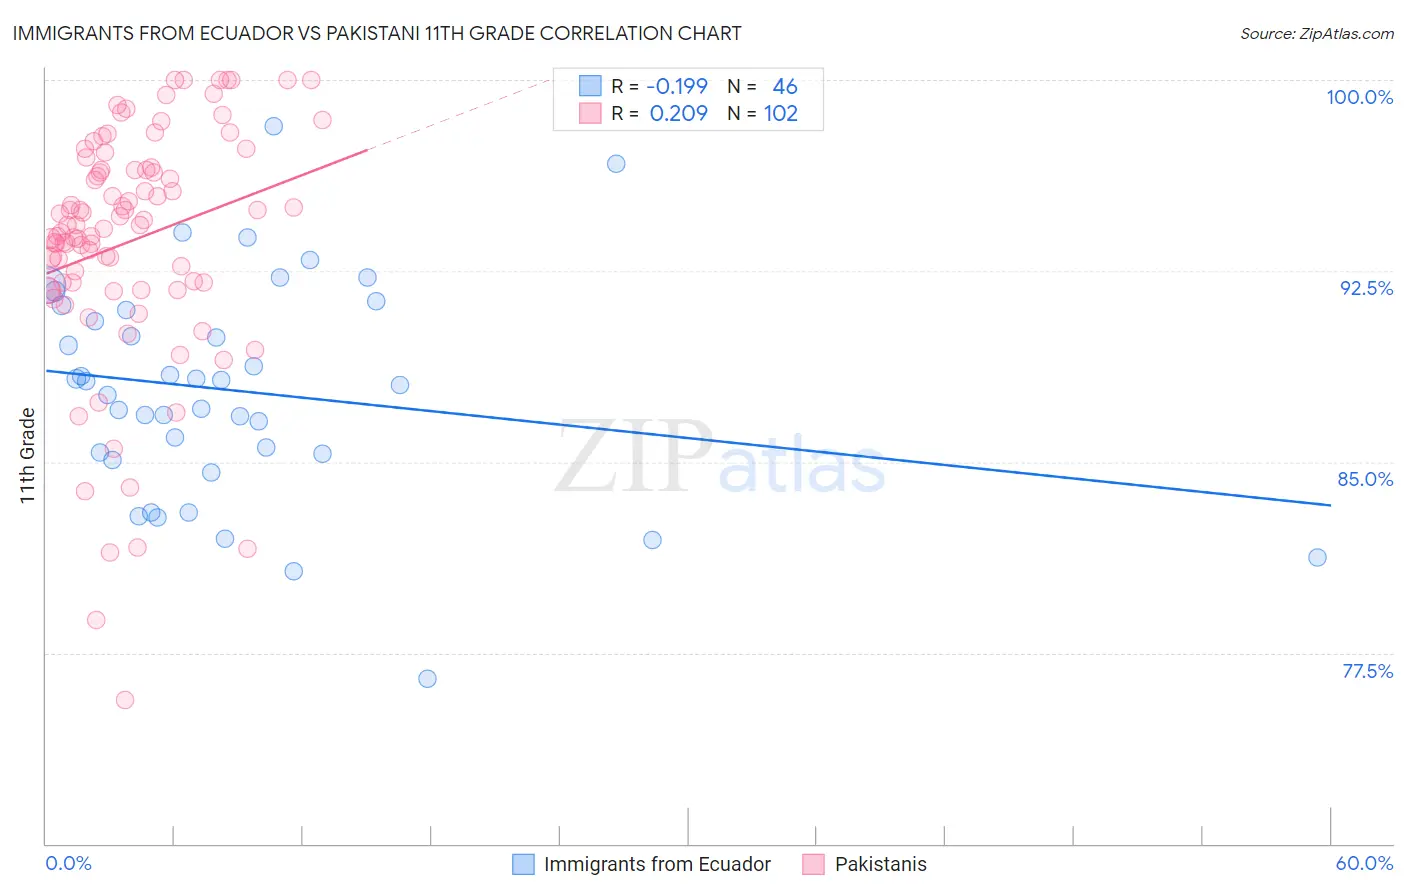
Immigrants from Ecuador vs Pakistani 11th Grade Correlation Chart
The statistical analysis conducted on geographies consisting of 270,907,929 people shows a poor negative correlation between the proportion of Immigrants from Ecuador and percentage of population with at least 11th grade education in the United States with a correlation coefficient (R) of -0.199 and weighted average of 89.1%. Similarly, the statistical analysis conducted on geographies consisting of 335,356,437 people shows a weak positive correlation between the proportion of Pakistanis and percentage of population with at least 11th grade education in the United States with a correlation coefficient (R) of 0.209 and weighted average of 92.8%, a difference of 4.2%.
11th Grade Correlation Summary
| Measurement | Immigrants from Ecuador | Pakistani |
| Minimum | 76.5% | 75.6% |
| Maximum | 98.2% | 100.0% |
| Range | 21.7% | 24.4% |
| Mean | 87.8% | 93.7% |
| Median | 88.1% | 94.3% |
| Interquartile 25% (IQ1) | 85.3% | 92.0% |
| Interquartile 75% (IQ3) | 91.0% | 96.5% |
| Interquartile Range (IQR) | 5.7% | 4.4% |
| Standard Deviation (Sample) | 4.3% | 4.7% |
| Standard Deviation (Population) | 4.3% | 4.7% |
Similar Demographics by 11th Grade
Demographics Similar to Immigrants from Ecuador by 11th Grade
In terms of 11th grade, the demographic groups most similar to Immigrants from Ecuador are Cape Verdean (89.1%, a difference of 0.010%), Immigrants from Caribbean (89.1%, a difference of 0.030%), Immigrants from Cuba (88.9%, a difference of 0.15%), Lumbee (88.9%, a difference of 0.16%), and Nicaraguan (88.9%, a difference of 0.22%).
| Demographics | Rating | Rank | 11th Grade |
| Nepalese | 0.0 /100 | #308 | Tragic 89.5% |
| Immigrants | Bangladesh | 0.0 /100 | #309 | Tragic 89.5% |
| Yaqui | 0.0 /100 | #310 | Tragic 89.5% |
| Vietnamese | 0.0 /100 | #311 | Tragic 89.4% |
| Immigrants | Portugal | 0.0 /100 | #312 | Tragic 89.3% |
| Immigrants | Caribbean | 0.0 /100 | #313 | Tragic 89.1% |
| Cape Verdeans | 0.0 /100 | #314 | Tragic 89.1% |
| Immigrants | Ecuador | 0.0 /100 | #315 | Tragic 89.1% |
| Immigrants | Cuba | 0.0 /100 | #316 | Tragic 88.9% |
| Lumbee | 0.0 /100 | #317 | Tragic 88.9% |
| Nicaraguans | 0.0 /100 | #318 | Tragic 88.9% |
| Belizeans | 0.0 /100 | #319 | Tragic 88.8% |
| Immigrants | Armenia | 0.0 /100 | #320 | Tragic 88.8% |
| Immigrants | Belize | 0.0 /100 | #321 | Tragic 88.7% |
| Puerto Ricans | 0.0 /100 | #322 | Tragic 88.4% |
Demographics Similar to Pakistanis by 11th Grade
In terms of 11th grade, the demographic groups most similar to Pakistanis are Assyrian/Chaldean/Syriac (92.8%, a difference of 0.010%), Iroquois (92.8%, a difference of 0.010%), Immigrants from Kenya (92.8%, a difference of 0.010%), Hmong (92.8%, a difference of 0.020%), and Immigrants from Poland (92.8%, a difference of 0.020%).
| Demographics | Rating | Rank | 11th Grade |
| Immigrants | Brazil | 85.1 /100 | #138 | Excellent 92.9% |
| Crow | 84.1 /100 | #139 | Excellent 92.9% |
| Venezuelans | 83.4 /100 | #140 | Excellent 92.9% |
| Chileans | 83.0 /100 | #141 | Excellent 92.9% |
| Kenyans | 82.0 /100 | #142 | Excellent 92.9% |
| Ugandans | 81.4 /100 | #143 | Excellent 92.9% |
| Assyrians/Chaldeans/Syriacs | 80.5 /100 | #144 | Excellent 92.8% |
| Pakistanis | 79.6 /100 | #145 | Good 92.8% |
| Iroquois | 79.1 /100 | #146 | Good 92.8% |
| Immigrants | Kenya | 78.7 /100 | #147 | Good 92.8% |
| Hmong | 78.6 /100 | #148 | Good 92.8% |
| Immigrants | Poland | 78.5 /100 | #149 | Good 92.8% |
| Immigrants | Egypt | 77.5 /100 | #150 | Good 92.8% |
| Potawatomi | 74.3 /100 | #151 | Good 92.8% |
| Iraqis | 74.2 /100 | #152 | Good 92.8% |