Immigrants from Eastern Africa vs Yup'ik Bachelor's Degree
COMPARE
Immigrants from Eastern Africa
Yup'ik
Bachelor's Degree
Bachelor's Degree Comparison
Immigrants from Eastern Africa
Yup'ik
40.4%
BACHELOR'S DEGREE
94.1/ 100
METRIC RATING
126th/ 347
METRIC RANK
19.4%
BACHELOR'S DEGREE
0.0/ 100
METRIC RATING
347th/ 347
METRIC RANK
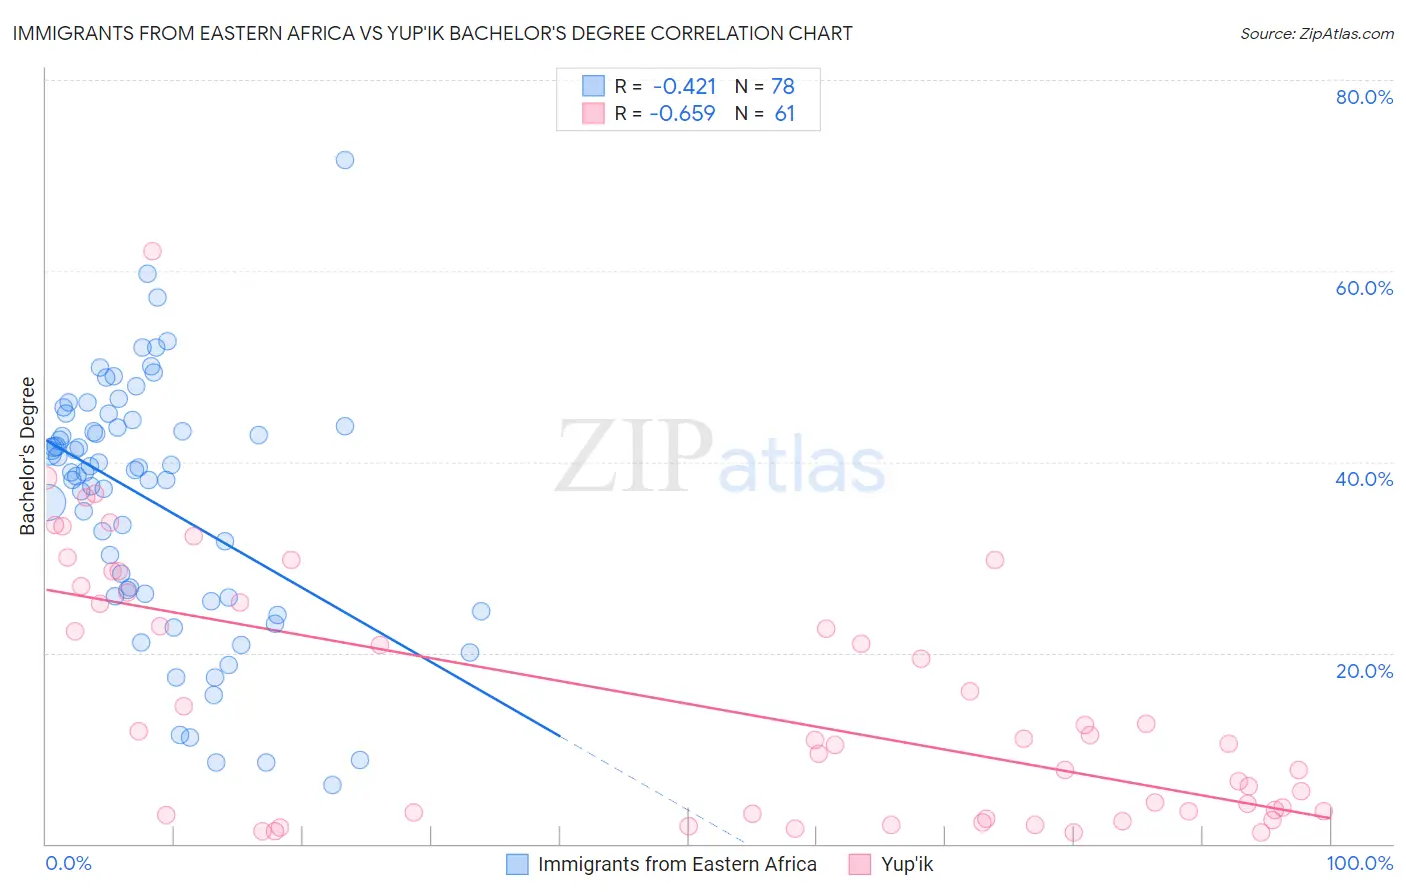
Immigrants from Eastern Africa vs Yup'ik Bachelor's Degree Correlation Chart
The statistical analysis conducted on geographies consisting of 355,129,315 people shows a moderate negative correlation between the proportion of Immigrants from Eastern Africa and percentage of population with at least bachelor's degree education in the United States with a correlation coefficient (R) of -0.421 and weighted average of 40.4%. Similarly, the statistical analysis conducted on geographies consisting of 39,961,864 people shows a significant negative correlation between the proportion of Yup'ik and percentage of population with at least bachelor's degree education in the United States with a correlation coefficient (R) of -0.659 and weighted average of 19.4%, a difference of 108.0%.
Bachelor's Degree Correlation Summary
| Measurement | Immigrants from Eastern Africa | Yup'ik |
| Minimum | 6.2% | 1.2% |
| Maximum | 71.6% | 62.1% |
| Range | 65.4% | 60.9% |
| Mean | 35.8% | 14.8% |
| Median | 39.1% | 10.9% |
| Interquartile 25% (IQ1) | 25.9% | 3.2% |
| Interquartile 75% (IQ3) | 43.7% | 25.8% |
| Interquartile Range (IQR) | 17.8% | 22.6% |
| Standard Deviation (Sample) | 13.1% | 13.3% |
| Standard Deviation (Population) | 13.1% | 13.2% |
Similar Demographics by Bachelor's Degree
Demographics Similar to Immigrants from Eastern Africa by Bachelor's Degree
In terms of bachelor's degree, the demographic groups most similar to Immigrants from Eastern Africa are British (40.4%, a difference of 0.050%), Immigrants from Eritrea (40.4%, a difference of 0.080%), Lebanese (40.4%, a difference of 0.090%), Immigrants from Albania (40.4%, a difference of 0.10%), and Moroccan (40.5%, a difference of 0.21%).
| Demographics | Rating | Rank | Bachelor's Degree |
| Immigrants | Syria | 94.9 /100 | #119 | Exceptional 40.5% |
| Venezuelans | 94.7 /100 | #120 | Exceptional 40.5% |
| Moroccans | 94.6 /100 | #121 | Exceptional 40.5% |
| Immigrants | Albania | 94.4 /100 | #122 | Exceptional 40.4% |
| Lebanese | 94.3 /100 | #123 | Exceptional 40.4% |
| Immigrants | Eritrea | 94.3 /100 | #124 | Exceptional 40.4% |
| British | 94.2 /100 | #125 | Exceptional 40.4% |
| Immigrants | Eastern Africa | 94.1 /100 | #126 | Exceptional 40.4% |
| Immigrants | Jordan | 93.4 /100 | #127 | Exceptional 40.3% |
| Immigrants | Venezuela | 92.9 /100 | #128 | Exceptional 40.2% |
| Serbians | 92.4 /100 | #129 | Exceptional 40.1% |
| Sierra Leoneans | 92.2 /100 | #130 | Exceptional 40.1% |
| Italians | 91.9 /100 | #131 | Exceptional 40.1% |
| Taiwanese | 91.1 /100 | #132 | Exceptional 40.0% |
| Immigrants | Southern Europe | 91.1 /100 | #133 | Exceptional 40.0% |
Demographics Similar to Yup'ik by Bachelor's Degree
In terms of bachelor's degree, the demographic groups most similar to Yup'ik are Houma (21.4%, a difference of 10.4%), Pima (23.2%, a difference of 19.5%), Navajo (23.6%, a difference of 21.6%), Tohono O'odham (24.4%, a difference of 25.8%), and Yakama (24.5%, a difference of 26.0%).
| Demographics | Rating | Rank | Bachelor's Degree |
| Mexicans | 0.0 /100 | #333 | Tragic 27.1% |
| Arapaho | 0.0 /100 | #334 | Tragic 26.6% |
| Natives/Alaskans | 0.0 /100 | #335 | Tragic 26.3% |
| Immigrants | Mexico | 0.0 /100 | #336 | Tragic 26.1% |
| Inupiat | 0.0 /100 | #337 | Tragic 25.8% |
| Pueblo | 0.0 /100 | #338 | Tragic 25.5% |
| Hopi | 0.0 /100 | #339 | Tragic 25.3% |
| Lumbee | 0.0 /100 | #340 | Tragic 24.8% |
| Yuman | 0.0 /100 | #341 | Tragic 24.5% |
| Yakama | 0.0 /100 | #342 | Tragic 24.5% |
| Tohono O'odham | 0.0 /100 | #343 | Tragic 24.4% |
| Navajo | 0.0 /100 | #344 | Tragic 23.6% |
| Pima | 0.0 /100 | #345 | Tragic 23.2% |
| Houma | 0.0 /100 | #346 | Tragic 21.4% |
| Yup'ik | 0.0 /100 | #347 | Tragic 19.4% |