Immigrants from Eastern Africa vs Immigrants from Nicaragua Doctorate Degree
COMPARE
Immigrants from Eastern Africa
Immigrants from Nicaragua
Doctorate Degree
Doctorate Degree Comparison
Immigrants from Eastern Africa
Immigrants from Nicaragua
2.1%
DOCTORATE DEGREE
98.2/ 100
METRIC RATING
101st/ 347
METRIC RANK
1.4%
DOCTORATE DEGREE
0.1/ 100
METRIC RATING
312th/ 347
METRIC RANK
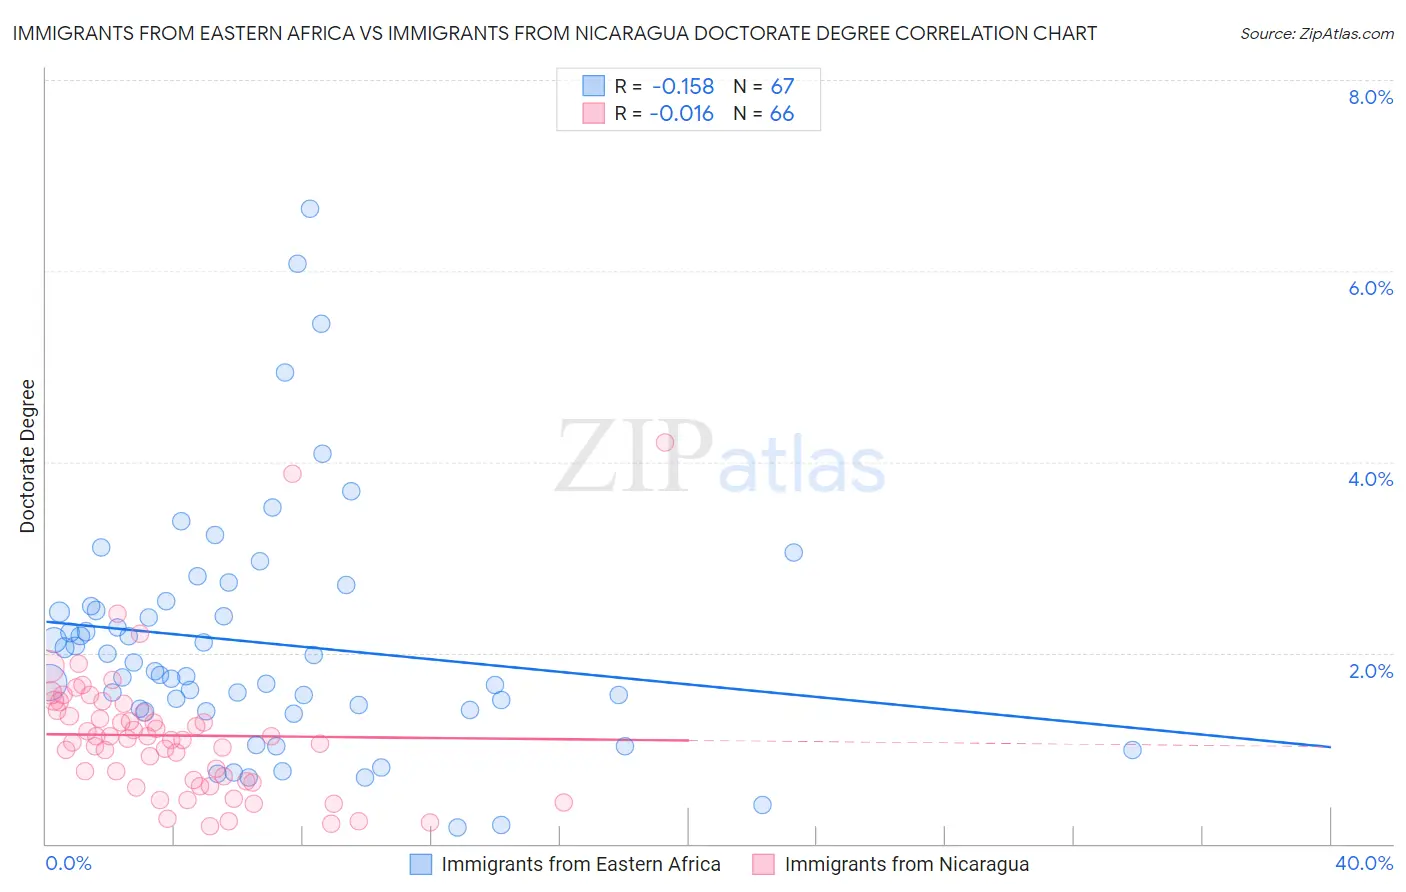
Immigrants from Eastern Africa vs Immigrants from Nicaragua Doctorate Degree Correlation Chart
The statistical analysis conducted on geographies consisting of 352,967,141 people shows a poor negative correlation between the proportion of Immigrants from Eastern Africa and percentage of population with at least doctorate degree education in the United States with a correlation coefficient (R) of -0.158 and weighted average of 2.1%. Similarly, the statistical analysis conducted on geographies consisting of 234,843,041 people shows no correlation between the proportion of Immigrants from Nicaragua and percentage of population with at least doctorate degree education in the United States with a correlation coefficient (R) of -0.016 and weighted average of 1.4%, a difference of 55.2%.
Doctorate Degree Correlation Summary
| Measurement | Immigrants from Eastern Africa | Immigrants from Nicaragua |
| Minimum | 0.18% | 0.18% |
| Maximum | 6.7% | 4.2% |
| Range | 6.5% | 4.0% |
| Mean | 2.1% | 1.1% |
| Median | 1.8% | 1.1% |
| Interquartile 25% (IQ1) | 1.4% | 0.66% |
| Interquartile 75% (IQ3) | 2.5% | 1.4% |
| Interquartile Range (IQR) | 1.1% | 0.74% |
| Standard Deviation (Sample) | 1.3% | 0.71% |
| Standard Deviation (Population) | 1.2% | 0.71% |
Similar Demographics by Doctorate Degree
Demographics Similar to Immigrants from Eastern Africa by Doctorate Degree
In terms of doctorate degree, the demographic groups most similar to Immigrants from Eastern Africa are Immigrants from Egypt (2.1%, a difference of 0.030%), Immigrants from Eastern Europe (2.1%, a difference of 0.030%), Armenian (2.1%, a difference of 0.21%), Immigrants from Chile (2.1%, a difference of 0.22%), and Romanian (2.1%, a difference of 0.23%).
| Demographics | Rating | Rank | Doctorate Degree |
| Greeks | 98.8 /100 | #94 | Exceptional 2.1% |
| Immigrants | Romania | 98.7 /100 | #95 | Exceptional 2.1% |
| Immigrants | Northern Africa | 98.4 /100 | #96 | Exceptional 2.1% |
| Immigrants | Eritrea | 98.4 /100 | #97 | Exceptional 2.1% |
| Armenians | 98.3 /100 | #98 | Exceptional 2.1% |
| Immigrants | Egypt | 98.2 /100 | #99 | Exceptional 2.1% |
| Immigrants | Eastern Europe | 98.2 /100 | #100 | Exceptional 2.1% |
| Immigrants | Eastern Africa | 98.2 /100 | #101 | Exceptional 2.1% |
| Immigrants | Chile | 98.1 /100 | #102 | Exceptional 2.1% |
| Romanians | 98.1 /100 | #103 | Exceptional 2.1% |
| Austrians | 98.0 /100 | #104 | Exceptional 2.1% |
| Arabs | 97.8 /100 | #105 | Exceptional 2.1% |
| Sudanese | 97.7 /100 | #106 | Exceptional 2.1% |
| Europeans | 97.5 /100 | #107 | Exceptional 2.1% |
| Immigrants | Germany | 97.3 /100 | #108 | Exceptional 2.1% |
Demographics Similar to Immigrants from Nicaragua by Doctorate Degree
In terms of doctorate degree, the demographic groups most similar to Immigrants from Nicaragua are Menominee (1.4%, a difference of 0.32%), Immigrants from Honduras (1.4%, a difference of 0.38%), Dominican (1.4%, a difference of 0.39%), Immigrants from the Azores (1.4%, a difference of 0.42%), and Immigrants from Jamaica (1.4%, a difference of 0.55%).
| Demographics | Rating | Rank | Doctorate Degree |
| Pennsylvania Germans | 0.1 /100 | #305 | Tragic 1.4% |
| Guyanese | 0.1 /100 | #306 | Tragic 1.4% |
| Cubans | 0.1 /100 | #307 | Tragic 1.4% |
| Immigrants | Laos | 0.1 /100 | #308 | Tragic 1.4% |
| Immigrants | Grenada | 0.1 /100 | #309 | Tragic 1.4% |
| Immigrants | Jamaica | 0.1 /100 | #310 | Tragic 1.4% |
| Immigrants | Honduras | 0.1 /100 | #311 | Tragic 1.4% |
| Immigrants | Nicaragua | 0.1 /100 | #312 | Tragic 1.4% |
| Menominee | 0.1 /100 | #313 | Tragic 1.4% |
| Dominicans | 0.1 /100 | #314 | Tragic 1.4% |
| Immigrants | Azores | 0.1 /100 | #315 | Tragic 1.4% |
| Navajo | 0.1 /100 | #316 | Tragic 1.4% |
| Immigrants | Micronesia | 0.1 /100 | #317 | Tragic 1.3% |
| Creek | 0.1 /100 | #318 | Tragic 1.3% |
| Immigrants | Guyana | 0.1 /100 | #319 | Tragic 1.3% |