Immigrants from Eastern Africa vs Immigrants from Malaysia 8th Grade
COMPARE
Immigrants from Eastern Africa
Immigrants from Malaysia
8th Grade
8th Grade Comparison
Immigrants from Eastern Africa
Immigrants from Malaysia
95.3%
8TH GRADE
5.6/ 100
METRIC RATING
228th/ 347
METRIC RANK
95.3%
8TH GRADE
7.3/ 100
METRIC RATING
222nd/ 347
METRIC RANK
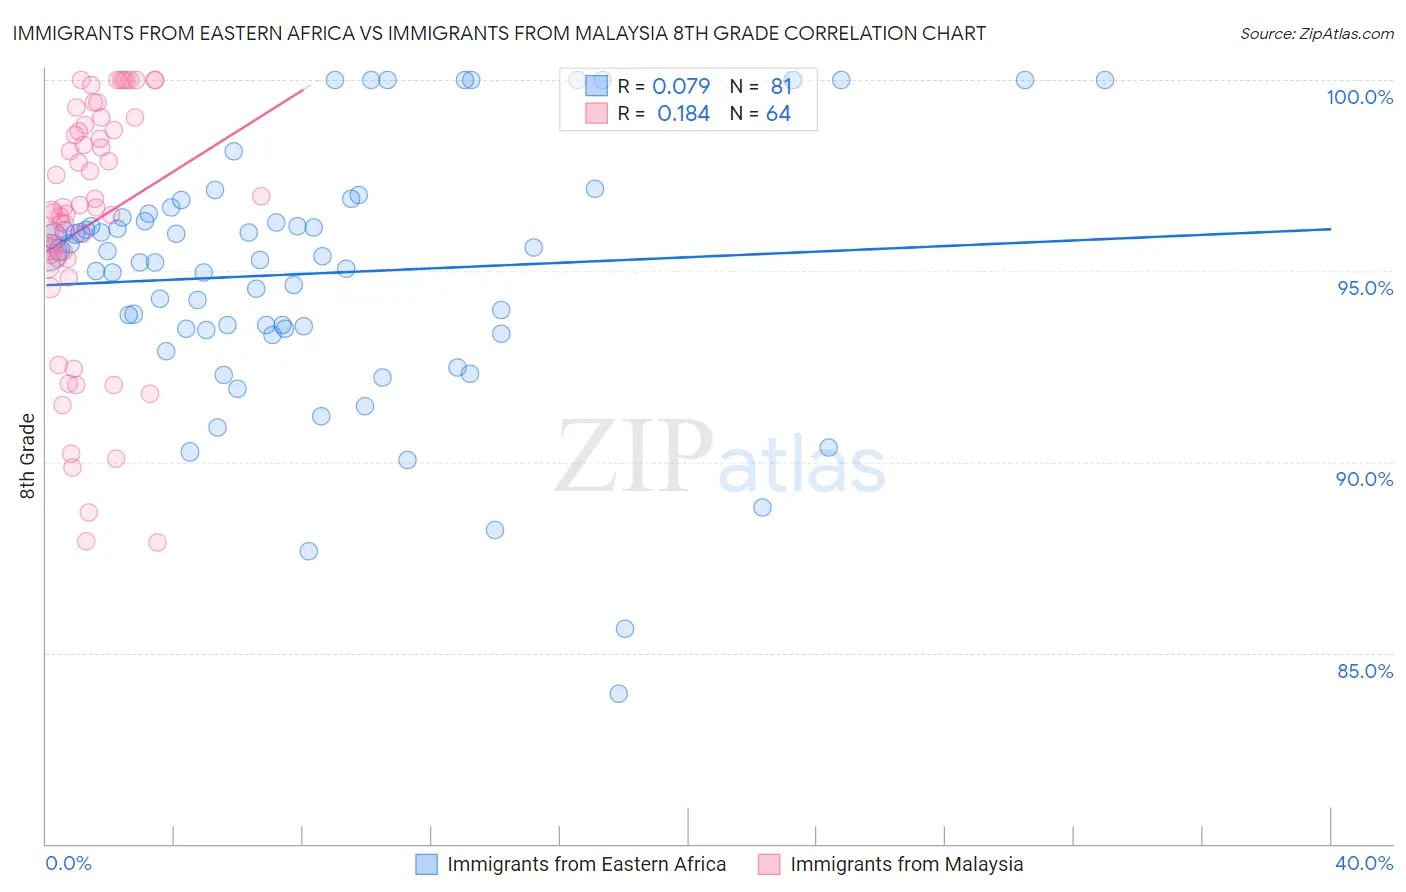
Immigrants from Eastern Africa vs Immigrants from Malaysia 8th Grade Correlation Chart
The statistical analysis conducted on geographies consisting of 355,144,184 people shows a slight positive correlation between the proportion of Immigrants from Eastern Africa and percentage of population with at least 8th grade education in the United States with a correlation coefficient (R) of 0.079 and weighted average of 95.3%. Similarly, the statistical analysis conducted on geographies consisting of 197,973,854 people shows a poor positive correlation between the proportion of Immigrants from Malaysia and percentage of population with at least 8th grade education in the United States with a correlation coefficient (R) of 0.184 and weighted average of 95.3%, a difference of 0.050%.
8th Grade Correlation Summary
| Measurement | Immigrants from Eastern Africa | Immigrants from Malaysia |
| Minimum | 83.9% | 87.9% |
| Maximum | 100.0% | 100.0% |
| Range | 16.1% | 12.1% |
| Mean | 94.9% | 96.2% |
| Median | 95.4% | 96.6% |
| Interquartile 25% (IQ1) | 93.5% | 95.2% |
| Interquartile 75% (IQ3) | 96.5% | 98.8% |
| Interquartile Range (IQR) | 3.0% | 3.5% |
| Standard Deviation (Sample) | 3.3% | 3.3% |
| Standard Deviation (Population) | 3.3% | 3.3% |
Demographics Similar to Immigrants from Eastern Africa and Immigrants from Malaysia by 8th Grade
In terms of 8th grade, the demographic groups most similar to Immigrants from Eastern Africa are Bahamian (95.3%, a difference of 0.0%), Immigrants from Western Asia (95.3%, a difference of 0.010%), Subsaharan African (95.3%, a difference of 0.010%), Navajo (95.3%, a difference of 0.010%), and Immigrants from Oceania (95.3%, a difference of 0.040%). Similarly, the demographic groups most similar to Immigrants from Malaysia are Immigrants from Syria (95.3%, a difference of 0.0%), Immigrants from Oceania (95.3%, a difference of 0.0%), Immigrants from Southern Europe (95.3%, a difference of 0.010%), Samoan (95.4%, a difference of 0.020%), and Immigrants from Eastern Asia (95.4%, a difference of 0.020%).
| Demographics | Rating | Rank | 8th Grade |
| Immigrants | Liberia | 8.9 /100 | #215 | Tragic 95.4% |
| Samoans | 8.4 /100 | #216 | Tragic 95.4% |
| Immigrants | Eastern Asia | 8.3 /100 | #217 | Tragic 95.4% |
| Dutch West Indians | 8.1 /100 | #218 | Tragic 95.4% |
| Spanish Americans | 8.0 /100 | #219 | Tragic 95.4% |
| Immigrants | Southern Europe | 7.7 /100 | #220 | Tragic 95.3% |
| Immigrants | Syria | 7.4 /100 | #221 | Tragic 95.3% |
| Immigrants | Malaysia | 7.3 /100 | #222 | Tragic 95.3% |
| Immigrants | Oceania | 7.1 /100 | #223 | Tragic 95.3% |
| Immigrants | Western Asia | 6.0 /100 | #224 | Tragic 95.3% |
| Sub-Saharan Africans | 6.0 /100 | #225 | Tragic 95.3% |
| Navajo | 5.7 /100 | #226 | Tragic 95.3% |
| Bahamians | 5.6 /100 | #227 | Tragic 95.3% |
| Immigrants | Eastern Africa | 5.6 /100 | #228 | Tragic 95.3% |
| Immigrants | Indonesia | 4.4 /100 | #229 | Tragic 95.3% |
| Immigrants | Panama | 4.1 /100 | #230 | Tragic 95.2% |
| Asians | 3.5 /100 | #231 | Tragic 95.2% |
| Indians (Asian) | 3.3 /100 | #232 | Tragic 95.2% |
| Immigrants | Asia | 3.1 /100 | #233 | Tragic 95.2% |
| Costa Ricans | 3.0 /100 | #234 | Tragic 95.2% |
| Nigerians | 2.9 /100 | #235 | Tragic 95.2% |