Immigrants from Eastern Africa vs Dominican Kindergarten
COMPARE
Immigrants from Eastern Africa
Dominican
Kindergarten
Kindergarten Comparison
Immigrants from Eastern Africa
Dominicans
97.6%
KINDERGARTEN
1.0/ 100
METRIC RATING
247th/ 347
METRIC RANK
96.8%
KINDERGARTEN
0.0/ 100
METRIC RATING
326th/ 347
METRIC RANK
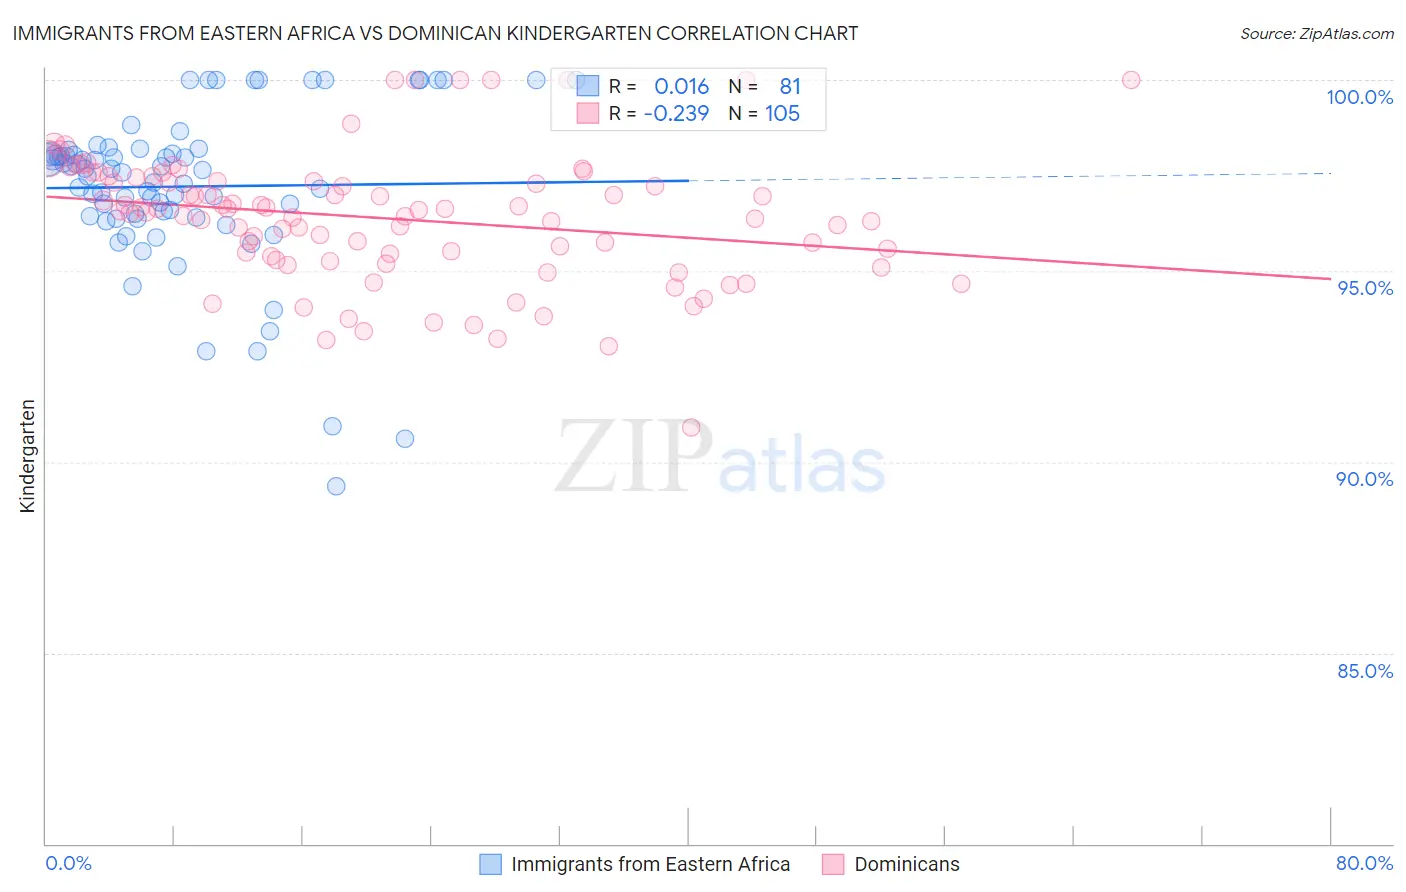
Immigrants from Eastern Africa vs Dominican Kindergarten Correlation Chart
The statistical analysis conducted on geographies consisting of 355,144,184 people shows no correlation between the proportion of Immigrants from Eastern Africa and percentage of population with at least kindergarten education in the United States with a correlation coefficient (R) of 0.016 and weighted average of 97.6%. Similarly, the statistical analysis conducted on geographies consisting of 355,142,603 people shows a weak negative correlation between the proportion of Dominicans and percentage of population with at least kindergarten education in the United States with a correlation coefficient (R) of -0.239 and weighted average of 96.8%, a difference of 0.86%.
Kindergarten Correlation Summary
| Measurement | Immigrants from Eastern Africa | Dominican |
| Minimum | 89.4% | 90.9% |
| Maximum | 100.0% | 100.0% |
| Range | 10.6% | 9.1% |
| Mean | 97.2% | 96.4% |
| Median | 97.6% | 96.6% |
| Interquartile 25% (IQ1) | 96.4% | 95.3% |
| Interquartile 75% (IQ3) | 98.1% | 97.4% |
| Interquartile Range (IQR) | 1.7% | 2.1% |
| Standard Deviation (Sample) | 2.1% | 1.7% |
| Standard Deviation (Population) | 2.1% | 1.7% |
Similar Demographics by Kindergarten
Demographics Similar to Immigrants from Eastern Africa by Kindergarten
In terms of kindergarten, the demographic groups most similar to Immigrants from Eastern Africa are South American (97.6%, a difference of 0.0%), Indian (Asian) (97.6%, a difference of 0.0%), Immigrants from Middle Africa (97.6%, a difference of 0.0%), Peruvian (97.6%, a difference of 0.0%), and Asian (97.6%, a difference of 0.010%).
| Demographics | Rating | Rank | Kindergarten |
| Koreans | 1.6 /100 | #240 | Tragic 97.6% |
| Liberians | 1.3 /100 | #241 | Tragic 97.6% |
| Immigrants | Indonesia | 1.3 /100 | #242 | Tragic 97.6% |
| Asians | 1.2 /100 | #243 | Tragic 97.6% |
| Bolivians | 1.2 /100 | #244 | Tragic 97.6% |
| South Americans | 1.1 /100 | #245 | Tragic 97.6% |
| Indians (Asian) | 1.0 /100 | #246 | Tragic 97.6% |
| Immigrants | Eastern Africa | 1.0 /100 | #247 | Tragic 97.6% |
| Immigrants | Middle Africa | 1.0 /100 | #248 | Tragic 97.6% |
| Peruvians | 1.0 /100 | #249 | Tragic 97.6% |
| Immigrants | Senegal | 0.9 /100 | #250 | Tragic 97.6% |
| Ethiopians | 0.9 /100 | #251 | Tragic 97.6% |
| Immigrants | Iraq | 0.9 /100 | #252 | Tragic 97.6% |
| Immigrants | Africa | 0.8 /100 | #253 | Tragic 97.6% |
| Immigrants | Asia | 0.8 /100 | #254 | Tragic 97.6% |
Demographics Similar to Dominicans by Kindergarten
In terms of kindergarten, the demographic groups most similar to Dominicans are Indonesian (96.8%, a difference of 0.010%), Vietnamese (96.8%, a difference of 0.030%), Immigrants from Honduras (96.8%, a difference of 0.040%), Immigrants from Bangladesh (96.8%, a difference of 0.060%), and Mexican American Indian (96.8%, a difference of 0.060%).
| Demographics | Rating | Rank | Kindergarten |
| Immigrants | Guyana | 0.0 /100 | #319 | Tragic 96.8% |
| Immigrants | Burma/Myanmar | 0.0 /100 | #320 | Tragic 96.8% |
| Immigrants | Bangladesh | 0.0 /100 | #321 | Tragic 96.8% |
| Mexican American Indians | 0.0 /100 | #322 | Tragic 96.8% |
| Immigrants | Honduras | 0.0 /100 | #323 | Tragic 96.8% |
| Vietnamese | 0.0 /100 | #324 | Tragic 96.8% |
| Indonesians | 0.0 /100 | #325 | Tragic 96.8% |
| Dominicans | 0.0 /100 | #326 | Tragic 96.8% |
| Mexicans | 0.0 /100 | #327 | Tragic 96.7% |
| Immigrants | Latin America | 0.0 /100 | #328 | Tragic 96.7% |
| Immigrants | Vietnam | 0.0 /100 | #329 | Tragic 96.7% |
| Japanese | 0.0 /100 | #330 | Tragic 96.7% |
| Immigrants | Armenia | 0.0 /100 | #331 | Tragic 96.6% |
| Yakama | 0.0 /100 | #332 | Tragic 96.6% |
| Central Americans | 0.0 /100 | #333 | Tragic 96.6% |