Immigrants from Dominican Republic vs Thai Associate's Degree
COMPARE
Immigrants from Dominican Republic
Thai
Associate's Degree
Associate's Degree Comparison
Immigrants from Dominican Republic
Thais
37.9%
ASSOCIATE'S DEGREE
0.0/ 100
METRIC RATING
310th/ 347
METRIC RANK
57.4%
ASSOCIATE'S DEGREE
100.0/ 100
METRIC RATING
8th/ 347
METRIC RANK
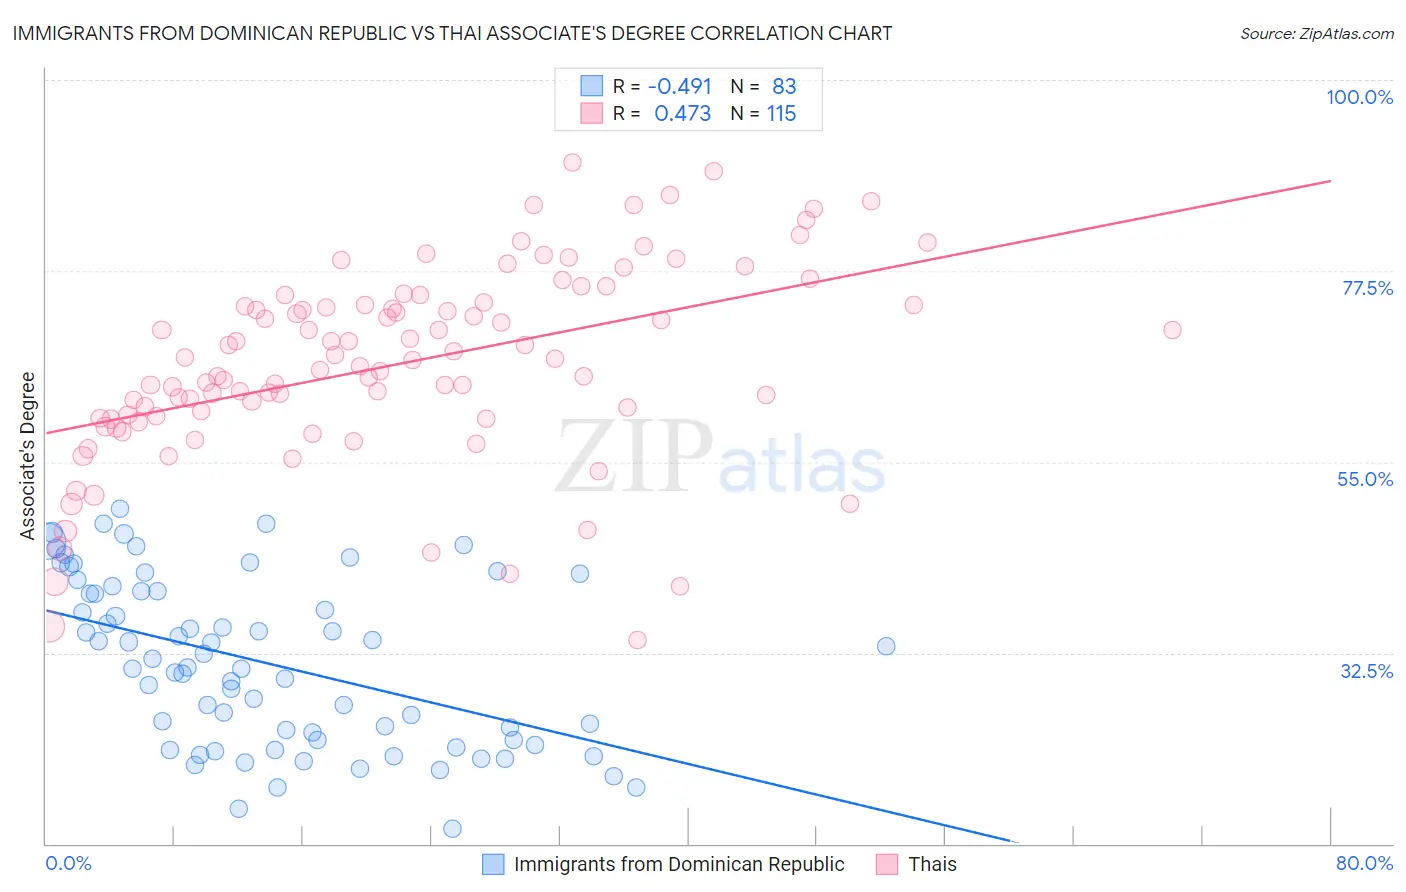
Immigrants from Dominican Republic vs Thai Associate's Degree Correlation Chart
The statistical analysis conducted on geographies consisting of 275,132,168 people shows a moderate negative correlation between the proportion of Immigrants from Dominican Republic and percentage of population with at least associate's degree education in the United States with a correlation coefficient (R) of -0.491 and weighted average of 37.9%. Similarly, the statistical analysis conducted on geographies consisting of 475,760,266 people shows a moderate positive correlation between the proportion of Thais and percentage of population with at least associate's degree education in the United States with a correlation coefficient (R) of 0.473 and weighted average of 57.4%, a difference of 51.5%.
Associate's Degree Correlation Summary
| Measurement | Immigrants from Dominican Republic | Thai |
| Minimum | 11.8% | 34.0% |
| Maximum | 49.4% | 90.2% |
| Range | 37.6% | 56.3% |
| Mean | 31.3% | 66.5% |
| Median | 30.8% | 66.9% |
| Interquartile 25% (IQ1) | 22.2% | 60.1% |
| Interquartile 75% (IQ3) | 39.7% | 73.5% |
| Interquartile Range (IQR) | 17.5% | 13.3% |
| Standard Deviation (Sample) | 9.8% | 11.4% |
| Standard Deviation (Population) | 9.7% | 11.4% |
Similar Demographics by Associate's Degree
Demographics Similar to Immigrants from Dominican Republic by Associate's Degree
In terms of associate's degree, the demographic groups most similar to Immigrants from Dominican Republic are Immigrants from Latin America (37.9%, a difference of 0.11%), Choctaw (37.8%, a difference of 0.33%), Hispanic or Latino (37.7%, a difference of 0.48%), Seminole (37.7%, a difference of 0.53%), and Immigrants from Guatemala (38.1%, a difference of 0.62%).
| Demographics | Rating | Rank | Associate's Degree |
| Guatemalans | 0.0 /100 | #303 | Tragic 38.5% |
| Sioux | 0.0 /100 | #304 | Tragic 38.5% |
| Immigrants | Honduras | 0.0 /100 | #305 | Tragic 38.5% |
| Shoshone | 0.0 /100 | #306 | Tragic 38.4% |
| Immigrants | El Salvador | 0.0 /100 | #307 | Tragic 38.4% |
| Mexican American Indians | 0.0 /100 | #308 | Tragic 38.2% |
| Immigrants | Guatemala | 0.0 /100 | #309 | Tragic 38.1% |
| Immigrants | Dominican Republic | 0.0 /100 | #310 | Tragic 37.9% |
| Immigrants | Latin America | 0.0 /100 | #311 | Tragic 37.9% |
| Choctaw | 0.0 /100 | #312 | Tragic 37.8% |
| Hispanics or Latinos | 0.0 /100 | #313 | Tragic 37.7% |
| Seminole | 0.0 /100 | #314 | Tragic 37.7% |
| Creek | 0.0 /100 | #315 | Tragic 37.6% |
| Crow | 0.0 /100 | #316 | Tragic 37.6% |
| Yaqui | 0.0 /100 | #317 | Tragic 37.6% |
Demographics Similar to Thais by Associate's Degree
In terms of associate's degree, the demographic groups most similar to Thais are Immigrants from Iran (57.7%, a difference of 0.40%), Okinawan (57.7%, a difference of 0.46%), Immigrants from Israel (56.8%, a difference of 1.1%), Iranian (58.2%, a difference of 1.3%), and Immigrants from Taiwan (58.4%, a difference of 1.7%).
| Demographics | Rating | Rank | Associate's Degree |
| Filipinos | 100.0 /100 | #1 | Exceptional 59.8% |
| Immigrants | Singapore | 100.0 /100 | #2 | Exceptional 58.9% |
| Immigrants | India | 100.0 /100 | #3 | Exceptional 58.5% |
| Immigrants | Taiwan | 100.0 /100 | #4 | Exceptional 58.4% |
| Iranians | 100.0 /100 | #5 | Exceptional 58.2% |
| Okinawans | 100.0 /100 | #6 | Exceptional 57.7% |
| Immigrants | Iran | 100.0 /100 | #7 | Exceptional 57.7% |
| Thais | 100.0 /100 | #8 | Exceptional 57.4% |
| Immigrants | Israel | 100.0 /100 | #9 | Exceptional 56.8% |
| Cypriots | 100.0 /100 | #10 | Exceptional 56.4% |
| Immigrants | Australia | 100.0 /100 | #11 | Exceptional 55.8% |
| Immigrants | South Central Asia | 100.0 /100 | #12 | Exceptional 55.7% |
| Immigrants | China | 100.0 /100 | #13 | Exceptional 55.5% |
| Immigrants | Hong Kong | 100.0 /100 | #14 | Exceptional 55.4% |
| Immigrants | Eastern Asia | 100.0 /100 | #15 | Exceptional 55.4% |