Immigrants from Dominican Republic vs Senegalese 11th Grade
COMPARE
Immigrants from Dominican Republic
Senegalese
11th Grade
11th Grade Comparison
Immigrants from Dominican Republic
Senegalese
86.9%
11TH GRADE
0.0/ 100
METRIC RATING
336th/ 347
METRIC RANK
91.6%
11TH GRADE
1.4/ 100
METRIC RATING
244th/ 347
METRIC RANK
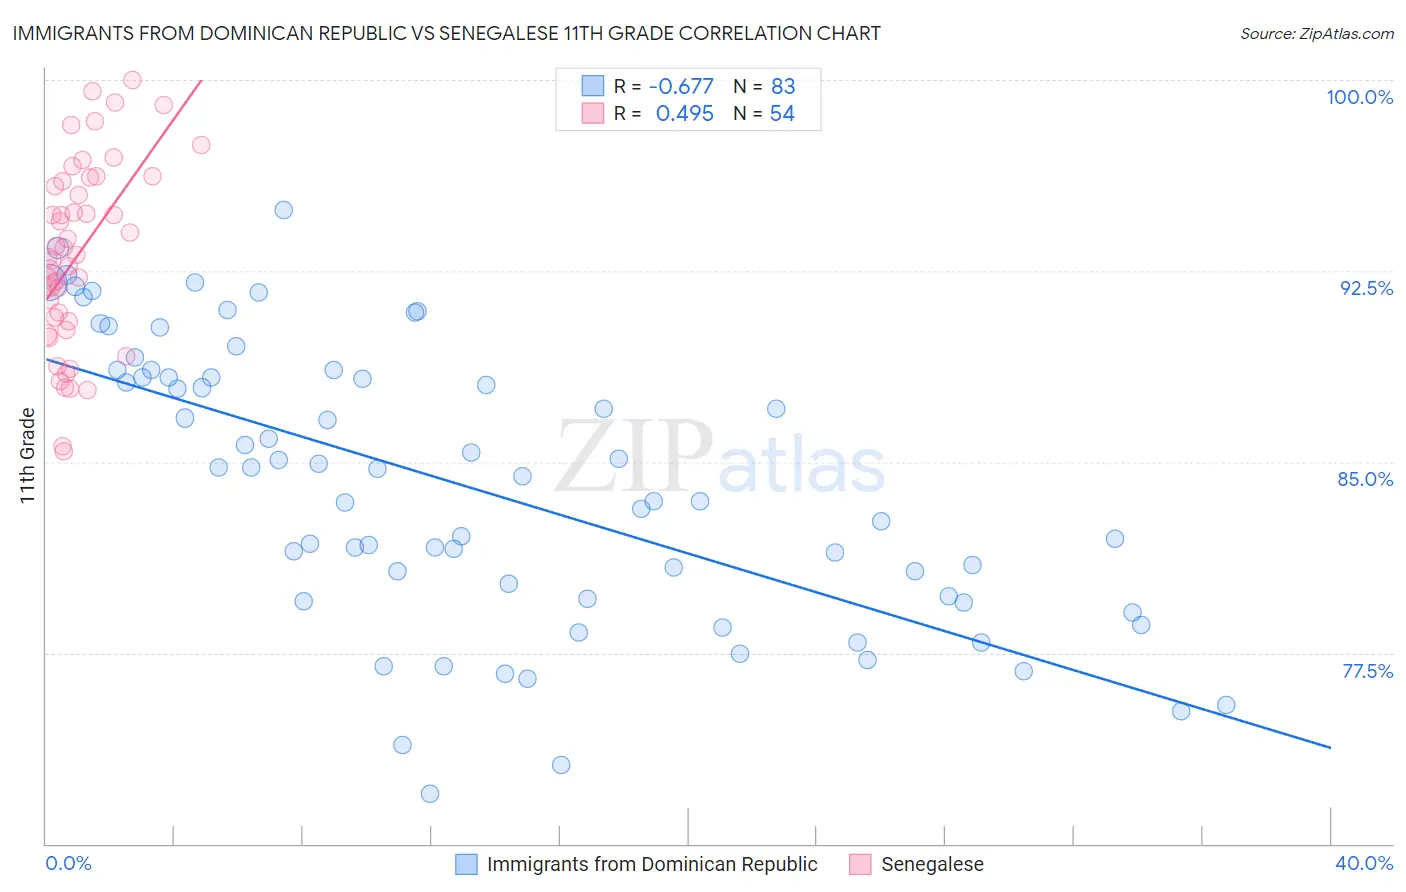
Immigrants from Dominican Republic vs Senegalese 11th Grade Correlation Chart
The statistical analysis conducted on geographies consisting of 275,144,349 people shows a significant negative correlation between the proportion of Immigrants from Dominican Republic and percentage of population with at least 11th grade education in the United States with a correlation coefficient (R) of -0.677 and weighted average of 86.9%. Similarly, the statistical analysis conducted on geographies consisting of 78,142,569 people shows a moderate positive correlation between the proportion of Senegalese and percentage of population with at least 11th grade education in the United States with a correlation coefficient (R) of 0.495 and weighted average of 91.6%, a difference of 5.3%.
11th Grade Correlation Summary
| Measurement | Immigrants from Dominican Republic | Senegalese |
| Minimum | 71.9% | 85.4% |
| Maximum | 94.9% | 100.0% |
| Range | 22.9% | 14.6% |
| Mean | 84.0% | 93.1% |
| Median | 84.4% | 93.1% |
| Interquartile 25% (IQ1) | 79.6% | 90.5% |
| Interquartile 75% (IQ3) | 88.3% | 96.0% |
| Interquartile Range (IQR) | 8.7% | 5.5% |
| Standard Deviation (Sample) | 5.5% | 3.6% |
| Standard Deviation (Population) | 5.4% | 3.6% |
Similar Demographics by 11th Grade
Demographics Similar to Immigrants from Dominican Republic by 11th Grade
In terms of 11th grade, the demographic groups most similar to Immigrants from Dominican Republic are Immigrants from Honduras (86.9%, a difference of 0.0%), Central American (86.9%, a difference of 0.040%), Immigrants from Latin America (86.8%, a difference of 0.12%), Houma (87.0%, a difference of 0.14%), and Immigrants from Yemen (87.1%, a difference of 0.20%).
| Demographics | Rating | Rank | 11th Grade |
| Mexican American Indians | 0.0 /100 | #329 | Tragic 87.5% |
| Hondurans | 0.0 /100 | #330 | Tragic 87.4% |
| Hispanics or Latinos | 0.0 /100 | #331 | Tragic 87.3% |
| Immigrants | Azores | 0.0 /100 | #332 | Tragic 87.2% |
| Immigrants | Yemen | 0.0 /100 | #333 | Tragic 87.1% |
| Houma | 0.0 /100 | #334 | Tragic 87.0% |
| Central Americans | 0.0 /100 | #335 | Tragic 86.9% |
| Immigrants | Dominican Republic | 0.0 /100 | #336 | Tragic 86.9% |
| Immigrants | Honduras | 0.0 /100 | #337 | Tragic 86.9% |
| Immigrants | Latin America | 0.0 /100 | #338 | Tragic 86.8% |
| Guatemalans | 0.0 /100 | #339 | Tragic 86.4% |
| Salvadorans | 0.0 /100 | #340 | Tragic 86.2% |
| Mexicans | 0.0 /100 | #341 | Tragic 86.1% |
| Immigrants | Guatemala | 0.0 /100 | #342 | Tragic 85.8% |
| Immigrants | El Salvador | 0.0 /100 | #343 | Tragic 85.3% |
Demographics Similar to Senegalese by 11th Grade
In terms of 11th grade, the demographic groups most similar to Senegalese are Immigrants from Thailand (91.6%, a difference of 0.010%), African (91.5%, a difference of 0.010%), Immigrants from Middle Africa (91.6%, a difference of 0.030%), Seminole (91.5%, a difference of 0.050%), and Bahamian (91.6%, a difference of 0.070%).
| Demographics | Rating | Rank | 11th Grade |
| Immigrants | Bolivia | 2.8 /100 | #237 | Tragic 91.7% |
| Comanche | 2.6 /100 | #238 | Tragic 91.7% |
| Hopi | 2.5 /100 | #239 | Tragic 91.7% |
| South Americans | 2.0 /100 | #240 | Tragic 91.6% |
| Bahamians | 1.8 /100 | #241 | Tragic 91.6% |
| Immigrants | Middle Africa | 1.6 /100 | #242 | Tragic 91.6% |
| Immigrants | Thailand | 1.4 /100 | #243 | Tragic 91.6% |
| Senegalese | 1.4 /100 | #244 | Tragic 91.6% |
| Africans | 1.3 /100 | #245 | Tragic 91.5% |
| Seminole | 1.2 /100 | #246 | Tragic 91.5% |
| Immigrants | Philippines | 1.0 /100 | #247 | Tragic 91.5% |
| Immigrants | Uzbekistan | 1.0 /100 | #248 | Tragic 91.5% |
| Peruvians | 1.0 /100 | #249 | Tragic 91.5% |
| Ghanaians | 0.9 /100 | #250 | Tragic 91.5% |
| Immigrants | Costa Rica | 0.9 /100 | #251 | Tragic 91.4% |