Immigrants from Dominica vs Immigrants from Armenia High School Diploma
COMPARE
Immigrants from Dominica
Immigrants from Armenia
High School Diploma
High School Diploma Comparison
Immigrants from Dominica
Immigrants from Armenia
85.2%
HIGH SCHOOL DIPLOMA
0.0/ 100
METRIC RATING
309th/ 347
METRIC RANK
85.2%
HIGH SCHOOL DIPLOMA
0.0/ 100
METRIC RATING
308th/ 347
METRIC RANK
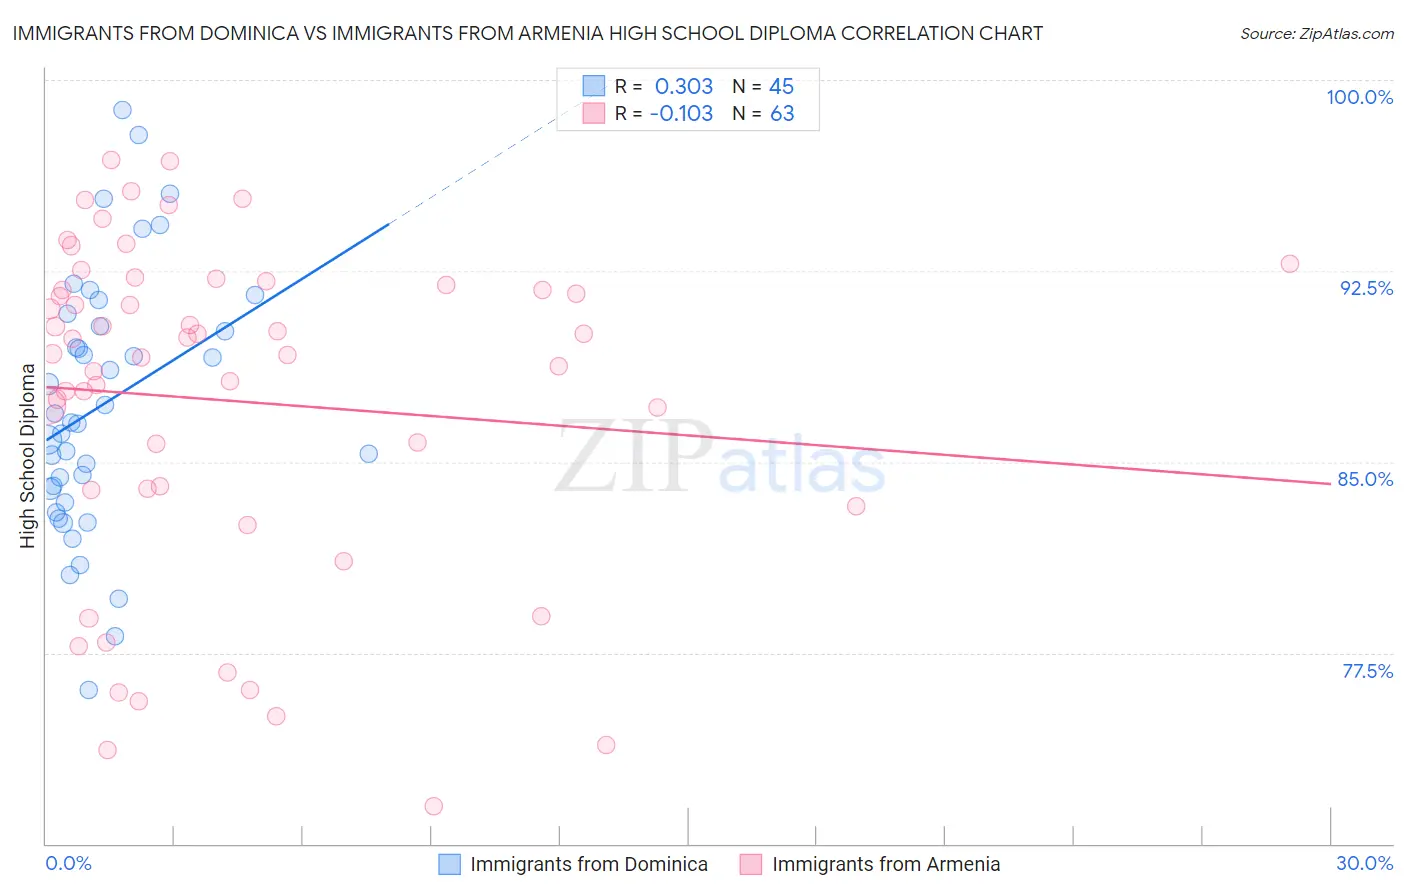
Immigrants from Dominica vs Immigrants from Armenia High School Diploma Correlation Chart
The statistical analysis conducted on geographies consisting of 83,794,115 people shows a mild positive correlation between the proportion of Immigrants from Dominica and percentage of population with at least high school diploma education in the United States with a correlation coefficient (R) of 0.303 and weighted average of 85.2%. Similarly, the statistical analysis conducted on geographies consisting of 97,657,339 people shows a poor negative correlation between the proportion of Immigrants from Armenia and percentage of population with at least high school diploma education in the United States with a correlation coefficient (R) of -0.103 and weighted average of 85.2%, a difference of 0.020%.
High School Diploma Correlation Summary
| Measurement | Immigrants from Dominica | Immigrants from Armenia |
| Minimum | 76.0% | 71.5% |
| Maximum | 98.8% | 96.9% |
| Range | 22.8% | 25.4% |
| Mean | 87.2% | 87.4% |
| Median | 86.5% | 89.2% |
| Interquartile 25% (IQ1) | 83.7% | 83.9% |
| Interquartile 75% (IQ3) | 90.6% | 92.0% |
| Interquartile Range (IQR) | 6.9% | 8.1% |
| Standard Deviation (Sample) | 5.1% | 6.6% |
| Standard Deviation (Population) | 5.0% | 6.5% |
Demographics Similar to Immigrants from Dominica and Immigrants from Armenia by High School Diploma
In terms of high school diploma, the demographic groups most similar to Immigrants from Dominica are Navajo (85.2%, a difference of 0.020%), Apache (85.1%, a difference of 0.080%), Ecuadorian (85.1%, a difference of 0.090%), Immigrants from Guyana (85.3%, a difference of 0.11%), and Cape Verdean (85.1%, a difference of 0.14%). Similarly, the demographic groups most similar to Immigrants from Armenia are Navajo (85.2%, a difference of 0.010%), Apache (85.1%, a difference of 0.090%), Immigrants from Guyana (85.3%, a difference of 0.10%), Ecuadorian (85.1%, a difference of 0.10%), and Immigrants from Portugal (85.3%, a difference of 0.14%).
| Demographics | Rating | Rank | High School Diploma |
| Natives/Alaskans | 0.0 /100 | #298 | Tragic 85.6% |
| Guyanese | 0.0 /100 | #299 | Tragic 85.5% |
| Immigrants | Bangladesh | 0.0 /100 | #300 | Tragic 85.5% |
| Vietnamese | 0.0 /100 | #301 | Tragic 85.4% |
| Immigrants | Haiti | 0.0 /100 | #302 | Tragic 85.4% |
| Cubans | 0.0 /100 | #303 | Tragic 85.4% |
| Nepalese | 0.0 /100 | #304 | Tragic 85.3% |
| Immigrants | Portugal | 0.0 /100 | #305 | Tragic 85.3% |
| Immigrants | Guyana | 0.0 /100 | #306 | Tragic 85.3% |
| Navajo | 0.0 /100 | #307 | Tragic 85.2% |
| Immigrants | Armenia | 0.0 /100 | #308 | Tragic 85.2% |
| Immigrants | Dominica | 0.0 /100 | #309 | Tragic 85.2% |
| Apache | 0.0 /100 | #310 | Tragic 85.1% |
| Ecuadorians | 0.0 /100 | #311 | Tragic 85.1% |
| Cape Verdeans | 0.0 /100 | #312 | Tragic 85.1% |
| Immigrants | Ecuador | 0.0 /100 | #313 | Tragic 84.8% |
| Yaqui | 0.0 /100 | #314 | Tragic 84.7% |
| Puerto Ricans | 0.0 /100 | #315 | Tragic 84.7% |
| Belizeans | 0.0 /100 | #316 | Tragic 84.3% |
| Immigrants | Caribbean | 0.0 /100 | #317 | Tragic 84.3% |
| Immigrants | Belize | 0.0 /100 | #318 | Tragic 84.2% |