Immigrants from Denmark vs Tsimshian 2nd Grade

COMPARE

Immigrants from Denmark
Race
Ancestry
AfghanAfricanAlaska NativeAlaskan AthabascanAlbanianAleutAlsatianAmericanApacheArabArapahoArgentineanArmenianAssyrian/Chaldean/SyriacAustralianAustrianBahamianBangladeshiBarbadianBasqueBelgianBelizeanBermudanBhutaneseBlackfeetBolivianBrazilianBritishBritish West IndianBulgarianBurmeseCajunCambodianCanadianCape VerdeanCarpatho RusynCelticCentral AmericanCentral American IndianCherokeeCheyenneChickasawChileanChineseChippewaChoctawColombianColvilleComancheCosta RicanCreeCreekCroatianCrowCubanCypriotCzechCzechoslovakianDanishDelawareDominicanDutchDutch West IndianEastern EuropeanEcuadorianEgyptianEnglishEstonianEthiopianEuropeanFijianFilipinoFinnishFrenchFrench American IndianFrench CanadianGermanGerman RussianGhanaianGreekGuamanian/ChamorroGuatemalanGuyaneseHaitianHmongHonduranHopiHoumaHungarianIcelanderIndian (Asian)IndonesianInupiatIranianIraqiIrishIroquoisIsraeliItalianJamaicanJapaneseJordanianKenyanKiowaKoreanLaotianLatvianLebaneseLiberianLithuanianLumbeeLuxembourgerMacedonianMalaysianMalteseMarshalleseMenomineeMexicanMexican American IndianMongolianMoroccanNative HawaiianNavajoNepaleseNew ZealanderNicaraguanNigerianNorthern EuropeanNorwegianOkinawanOsageOttawaPaiutePakistaniPalestinianPanamanianParaguayanPennsylvania GermanPeruvianPimaPolishPortuguesePotawatomiPuebloPuerto RicanPuget Sound SalishRomanianRussianSalvadoranSamoanScandinavianScotch-IrishScottishSeminoleSenegaleseSerbianShoshoneSierra LeoneanSiouxSlavicSlovakSloveneSomaliSouth AfricanSouth AmericanSouth American IndianSoviet UnionSpaniardSpanishSpanish AmericanSpanish American IndianSri LankanSubsaharan AfricanSudaneseSwedishSwissSyrianTaiwaneseThaiTlingit-HaidaTohono O'OdhamTonganTrinidadian and TobagonianTurkishU.S. Virgin IslanderUgandanUkrainianUruguayanUteVenezuelanVietnameseWelshWest IndianYakamaYaquiYugoslavianYumanYup'ikZimbabwean
Immigration
NonimmigrantsImmigrantsAfghanistanAfricaAlbaniaArgentinaArmeniaAsiaAustraliaAustriaBahamasBangladeshBarbadosBelarusBelgiumBelizeBoliviaBosnia and HerzegovinaBrazilBulgariaBurma/MyanmarCabo VerdeCambodiaCameroonCanadaCaribbeanCentral AmericaChileChinaColombiaCongoCosta RicaCroatiaCubaCzechoslovakiaDenmarkDominicaDominican RepublicEastern AfricaEastern AsiaEastern EuropeEcuadorEgyptEl SalvadorEnglandEritreaEthiopiaEuropeFijiFranceGermanyGhanaGreeceGrenadaGuatemalaGuyanaHaitiHondurasHong KongHungaryIndiaIndonesiaIranIraqIrelandIsraelItalyJamaicaJapanJordanKazakhstanKenyaKoreaKuwaitLaosLatin AmericaLatviaLebanonLiberiaLithuaniaMalaysiaMexicoMicronesiaMiddle AfricaMoldovaMoroccoNepalNetherlandsNicaraguaNigeriaNorth AmericaNorth MacedoniaNorthern AfricaNorthern EuropeNorwayOceaniaPakistanPanamaPeruPhilippinesPolandPortugalRomaniaRussiaSaudi ArabiaScotlandSenegalSerbiaSierra LeoneSingaporeSomaliaSouth AfricaSouth AmericaSouth Central AsiaSouth Eastern AsiaSouthern EuropeSpainSri LankaSt. Vincent and the GrenadinesSudanSwedenSwitzerlandSyriaTaiwanThailandTrinidad and TobagoTurkeyUgandaUkraineUruguayUzbekistanVenezuelaVietnamWest IndiesWestern AfricaWestern AsiaWestern EuropeYemenZaireZimbabweAzores
Tsimshian
Race
Ancestry
AfghanAfricanAlaska NativeAlaskan AthabascanAlbanianAleutAlsatianAmericanApacheArabArapahoArgentineanArmenianAssyrian/Chaldean/SyriacAustralianAustrianBahamianBangladeshiBarbadianBasqueBelgianBelizeanBermudanBhutaneseBlackfeetBolivianBrazilianBritishBritish West IndianBulgarianBurmeseCajunCambodianCanadianCape VerdeanCarpatho RusynCelticCentral AmericanCentral American IndianCherokeeCheyenneChickasawChileanChineseChippewaChoctawColombianColvilleComancheCosta RicanCreeCreekCroatianCrowCubanCypriotCzechCzechoslovakianDanishDelawareDominicanDutchDutch West IndianEastern EuropeanEcuadorianEgyptianEnglishEstonianEthiopianEuropeanFijianFilipinoFinnishFrenchFrench American IndianFrench CanadianGermanGerman RussianGhanaianGreekGuamanian/ChamorroGuatemalanGuyaneseHaitianHmongHonduranHopiHoumaHungarianIcelanderIndian (Asian)IndonesianInupiatIranianIraqiIrishIroquoisIsraeliItalianJamaicanJapaneseJordanianKenyanKiowaKoreanLaotianLatvianLebaneseLiberianLithuanianLumbeeLuxembourgerMacedonianMalaysianMalteseMarshalleseMenomineeMexicanMexican American IndianMongolianMoroccanNative HawaiianNavajoNepaleseNew ZealanderNicaraguanNigerianNorthern EuropeanNorwegianOkinawanOsageOttawaPaiutePakistaniPalestinianPanamanianParaguayanPennsylvania GermanPeruvianPimaPolishPortuguesePotawatomiPuebloPuerto RicanPuget Sound SalishRomanianRussianSalvadoranSamoanScandinavianScotch-IrishScottishSeminoleSenegaleseSerbianShoshoneSierra LeoneanSiouxSlavicSlovakSloveneSomaliSouth AfricanSouth AmericanSouth American IndianSoviet UnionSpaniardSpanishSpanish AmericanSpanish American IndianSri LankanSubsaharan AfricanSudaneseSwedishSwissSyrianTaiwaneseThaiTlingit-HaidaTohono O'OdhamTonganTrinidadian and TobagonianTsimshianTurkishU.S. Virgin IslanderUgandanUkrainianUruguayanUteVenezuelanVietnameseWelshWest IndianYakamaYaquiYugoslavianYumanYup'ikZimbabwean
Immigration
NonimmigrantsImmigrantsAfghanistanAfricaAlbaniaArgentinaArmeniaAsiaAustraliaAustriaBahamasBangladeshBarbadosBelarusBelgiumBelizeBoliviaBosnia and HerzegovinaBrazilBulgariaBurma/MyanmarCabo VerdeCambodiaCameroonCanadaCaribbeanCentral AmericaChileChinaColombiaCongoCosta RicaCroatiaCubaCzechoslovakiaDominicaDominican RepublicEastern AfricaEastern AsiaEastern EuropeEcuadorEgyptEl SalvadorEnglandEritreaEthiopiaEuropeFijiFranceGermanyGhanaGreeceGrenadaGuatemalaGuyanaHaitiHondurasHong KongHungaryIndiaIndonesiaIranIraqIrelandIsraelItalyJamaicaJapanJordanKazakhstanKenyaKoreaKuwaitLaosLatin AmericaLatviaLebanonLiberiaLithuaniaMalaysiaMexicoMicronesiaMiddle AfricaMoldovaMoroccoNepalNetherlandsNicaraguaNigeriaNorth AmericaNorth MacedoniaNorthern AfricaNorthern EuropeNorwayOceaniaPakistanPanamaPeruPhilippinesPolandPortugalRomaniaRussiaSaudi ArabiaScotlandSenegalSerbiaSierra LeoneSingaporeSomaliaSouth AfricaSouth AmericaSouth Central AsiaSouth Eastern AsiaSouthern EuropeSpainSri LankaSt. Vincent and the GrenadinesSudanSwedenSwitzerlandSyriaTaiwanThailandTrinidad and TobagoTurkeyUgandaUkraineUruguayUzbekistanVenezuelaVietnamWest IndiesWestern AfricaWestern AsiaWestern EuropeYemenZaireZimbabweAzores
2nd Grade
Income
Poverty
Unemployment
Labor Participation
Family Structure
Vehicle Availability
Education Level
Disability

2nd Grade Comparison

Immigrants from Denmark

Tsimshian

Exceptional
Exceptional
98.2%
2ND GRADE
99.0/ 100
METRIC RATING
87th/ 347
METRIC RANK
98.8%
2ND GRADE
100.0/ 100
METRIC RATING
4th/ 347
METRIC RANK

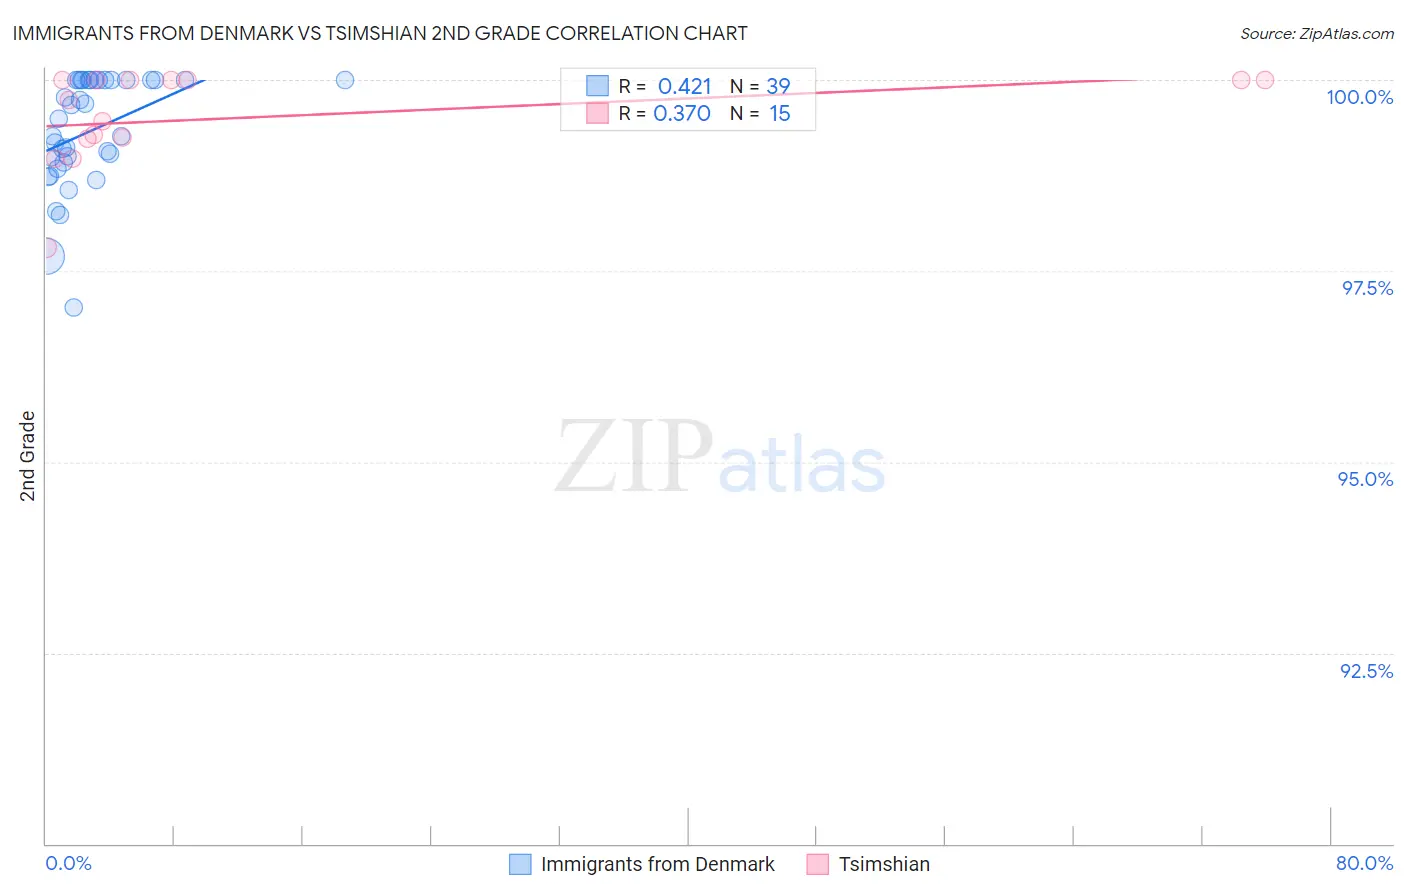
Immigrants from Denmark vs Tsimshian 2nd Grade Correlation Chart

The statistical analysis conducted on geographies consisting of 136,428,049 people shows a moderate positive correlation between the proportion of Immigrants from Denmark and percentage of population with at least 2nd grade education in the United States with a correlation coefficient (R) of 0.421 and weighted average of 98.2%. Similarly, the statistical analysis conducted on geographies consisting of 15,626,544 people shows a mild positive correlation between the proportion of Tsimshian and percentage of population with at least 2nd grade education in the United States with a correlation coefficient (R) of 0.370 and weighted average of 98.8%, a difference of 0.59%.
Immigrants from Denmark vs Tsimshian 2nd Grade

2nd Grade Correlation Summary

MeasurementImmigrants from DenmarkTsimshian
Minimum97.0%97.8%
Maximum100.0%100.0%
Range3.0%2.2%
Mean99.3%99.5%
Median99.5%99.7%
Interquartile 25% (IQ1)98.9%99.2%
Interquartile 75% (IQ3)100.0%100.0%
Interquartile Range (IQR)1.1%0.77%
Standard Deviation (Sample)0.73%0.62%
Standard Deviation (Population)0.72%0.60%

Similar Demographics by 2nd Grade

Demographics Similar to Immigrants from Denmark by 2nd Grade

In terms of 2nd grade, the demographic groups most similar to Immigrants from Denmark are Potawatomi (98.2%, a difference of 0.0%), Immigrants from Australia (98.2%, a difference of 0.0%), Macedonian (98.2%, a difference of 0.0%), Icelander (98.2%, a difference of 0.010%), and Delaware (98.2%, a difference of 0.010%).
DemographicsRating | Rank2nd Grade
Osage
99.2
/100
|
#80
Exceptional
98.2%
Icelanders
99.2
/100
|
#81
Exceptional
98.2%
Delaware
99.1
/100
|
#82
Exceptional
98.2%
Immigrants | Sweden
99.1
/100
|
#83
Exceptional
98.2%
Hopi
99.1
/100
|
#84
Exceptional
98.2%
Potawatomi
99.1
/100
|
#85
Exceptional
98.2%
Immigrants | Australia
99.0
/100
|
#86
Exceptional
98.2%
Immigrants | Denmark
99.0
/100
|
#87
Exceptional
98.2%
Macedonians
99.0
/100
|
#88
Exceptional
98.2%
Ukrainians
98.9
/100
|
#89
Exceptional
98.2%
Zimbabweans
98.8
/100
|
#90
Exceptional
98.2%
Immigrants | Western Europe
98.8
/100
|
#91
Exceptional
98.2%
Immigrants | South Africa
98.8
/100
|
#92
Exceptional
98.2%
Immigrants | India
98.8
/100
|
#93
Exceptional
98.2%
Immigrants | Germany
98.6
/100
|
#94
Exceptional
98.2%

Demographics Similar to Tsimshian by 2nd Grade

In terms of 2nd grade, the demographic groups most similar to Tsimshian are Inupiat (98.8%, a difference of 0.040%), Alaskan Athabascan (98.7%, a difference of 0.080%), Alaska Native (98.7%, a difference of 0.12%), Norwegian (98.7%, a difference of 0.13%), and German (98.7%, a difference of 0.15%).
DemographicsRating | Rank2nd Grade
Crow
100.0
/100
|
#1
Exceptional
99.6%
Yup'ik
100.0
/100
|
#2
Exceptional
99.2%
Inupiat
100.0
/100
|
#3
Exceptional
98.8%
Tsimshian
100.0
/100
|
#4
Exceptional
98.8%
Alaskan Athabascans
100.0
/100
|
#5
Exceptional
98.7%
Alaska Natives
100.0
/100
|
#6
Exceptional
98.7%
Norwegians
100.0
/100
|
#7
Exceptional
98.7%
Germans
100.0
/100
|
#8
Exceptional
98.7%
Slovaks
100.0
/100
|
#9
Exceptional
98.7%
Slovenes
100.0
/100
|
#10
Exceptional
98.6%
Tlingit-Haida
100.0
/100
|
#11
Exceptional
98.6%
Carpatho Rusyns
100.0
/100
|
#12
Exceptional
98.6%
English
100.0
/100
|
#13
Exceptional
98.6%
Swedes
100.0
/100
|
#14
Exceptional
98.6%
Scottish
100.0
/100
|
#15
Exceptional
98.6%