Immigrants from Denmark vs Chickasaw Associate's Degree
COMPARE
Immigrants from Denmark
Chickasaw
Associate's Degree
Associate's Degree Comparison
Immigrants from Denmark
Chickasaw
53.1%
ASSOCIATE'S DEGREE
100.0/ 100
METRIC RATING
37th/ 347
METRIC RANK
38.6%
ASSOCIATE'S DEGREE
0.0/ 100
METRIC RATING
300th/ 347
METRIC RANK
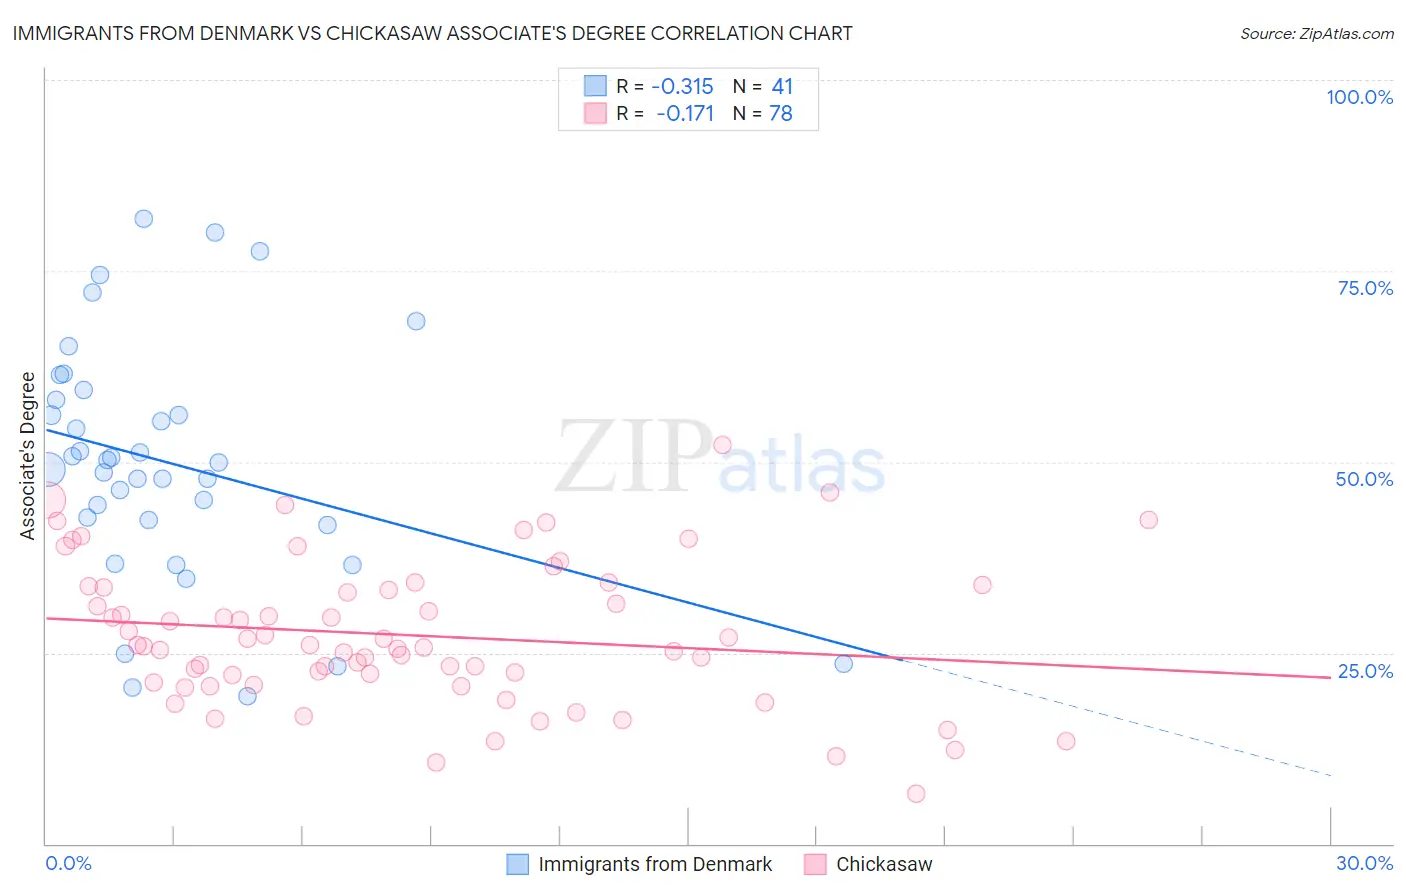
Immigrants from Denmark vs Chickasaw Associate's Degree Correlation Chart
The statistical analysis conducted on geographies consisting of 136,428,731 people shows a mild negative correlation between the proportion of Immigrants from Denmark and percentage of population with at least associate's degree education in the United States with a correlation coefficient (R) of -0.315 and weighted average of 53.1%. Similarly, the statistical analysis conducted on geographies consisting of 147,722,780 people shows a poor negative correlation between the proportion of Chickasaw and percentage of population with at least associate's degree education in the United States with a correlation coefficient (R) of -0.171 and weighted average of 38.6%, a difference of 37.4%.
Associate's Degree Correlation Summary
| Measurement | Immigrants from Denmark | Chickasaw |
| Minimum | 19.3% | 6.5% |
| Maximum | 81.9% | 52.2% |
| Range | 62.5% | 45.7% |
| Mean | 49.9% | 27.3% |
| Median | 50.0% | 25.9% |
| Interquartile 25% (IQ1) | 42.1% | 21.1% |
| Interquartile 75% (IQ3) | 58.7% | 33.6% |
| Interquartile Range (IQR) | 16.6% | 12.5% |
| Standard Deviation (Sample) | 15.6% | 9.4% |
| Standard Deviation (Population) | 15.4% | 9.3% |
Similar Demographics by Associate's Degree
Demographics Similar to Immigrants from Denmark by Associate's Degree
In terms of associate's degree, the demographic groups most similar to Immigrants from Denmark are Immigrants from Russia (53.1%, a difference of 0.080%), Mongolian (53.0%, a difference of 0.16%), Russian (53.2%, a difference of 0.36%), Bulgarian (53.3%, a difference of 0.43%), and Immigrants from Belarus (52.8%, a difference of 0.45%).
| Demographics | Rating | Rank | Associate's Degree |
| Immigrants | Sri Lanka | 100.0 /100 | #30 | Exceptional 53.7% |
| Immigrants | Northern Europe | 100.0 /100 | #31 | Exceptional 53.5% |
| Immigrants | Turkey | 100.0 /100 | #32 | Exceptional 53.4% |
| Israelis | 100.0 /100 | #33 | Exceptional 53.4% |
| Bulgarians | 100.0 /100 | #34 | Exceptional 53.3% |
| Russians | 100.0 /100 | #35 | Exceptional 53.2% |
| Immigrants | Russia | 100.0 /100 | #36 | Exceptional 53.1% |
| Immigrants | Denmark | 100.0 /100 | #37 | Exceptional 53.1% |
| Mongolians | 100.0 /100 | #38 | Exceptional 53.0% |
| Immigrants | Belarus | 99.9 /100 | #39 | Exceptional 52.8% |
| Immigrants | Latvia | 99.9 /100 | #40 | Exceptional 52.8% |
| Immigrants | Saudi Arabia | 99.9 /100 | #41 | Exceptional 52.6% |
| Immigrants | Malaysia | 99.9 /100 | #42 | Exceptional 52.5% |
| Immigrants | South Africa | 99.9 /100 | #43 | Exceptional 52.5% |
| Estonians | 99.9 /100 | #44 | Exceptional 52.5% |
Demographics Similar to Chickasaw by Associate's Degree
In terms of associate's degree, the demographic groups most similar to Chickasaw are Ute (38.6%, a difference of 0.040%), Tsimshian (38.6%, a difference of 0.060%), Cheyenne (38.7%, a difference of 0.13%), Colville (38.5%, a difference of 0.20%), and Guatemalan (38.5%, a difference of 0.29%).
| Demographics | Rating | Rank | Associate's Degree |
| Nepalese | 0.0 /100 | #293 | Tragic 39.0% |
| Salvadorans | 0.0 /100 | #294 | Tragic 39.0% |
| Hondurans | 0.0 /100 | #295 | Tragic 38.9% |
| Cherokee | 0.0 /100 | #296 | Tragic 38.9% |
| Cape Verdeans | 0.0 /100 | #297 | Tragic 38.8% |
| Cheyenne | 0.0 /100 | #298 | Tragic 38.7% |
| Ute | 0.0 /100 | #299 | Tragic 38.6% |
| Chickasaw | 0.0 /100 | #300 | Tragic 38.6% |
| Tsimshian | 0.0 /100 | #301 | Tragic 38.6% |
| Colville | 0.0 /100 | #302 | Tragic 38.5% |
| Guatemalans | 0.0 /100 | #303 | Tragic 38.5% |
| Sioux | 0.0 /100 | #304 | Tragic 38.5% |
| Immigrants | Honduras | 0.0 /100 | #305 | Tragic 38.5% |
| Shoshone | 0.0 /100 | #306 | Tragic 38.4% |
| Immigrants | El Salvador | 0.0 /100 | #307 | Tragic 38.4% |