Immigrants from Czechoslovakia vs Zimbabwean 12th Grade, No Diploma
COMPARE
Immigrants from Czechoslovakia
Zimbabwean
12th Grade, No Diploma
12th Grade, No Diploma Comparison
Immigrants from Czechoslovakia
Zimbabweans
92.7%
12TH GRADE, NO DIPLOMA
99.5/ 100
METRIC RATING
68th/ 347
METRIC RANK
92.7%
12TH GRADE, NO DIPLOMA
99.6/ 100
METRIC RATING
63rd/ 347
METRIC RANK
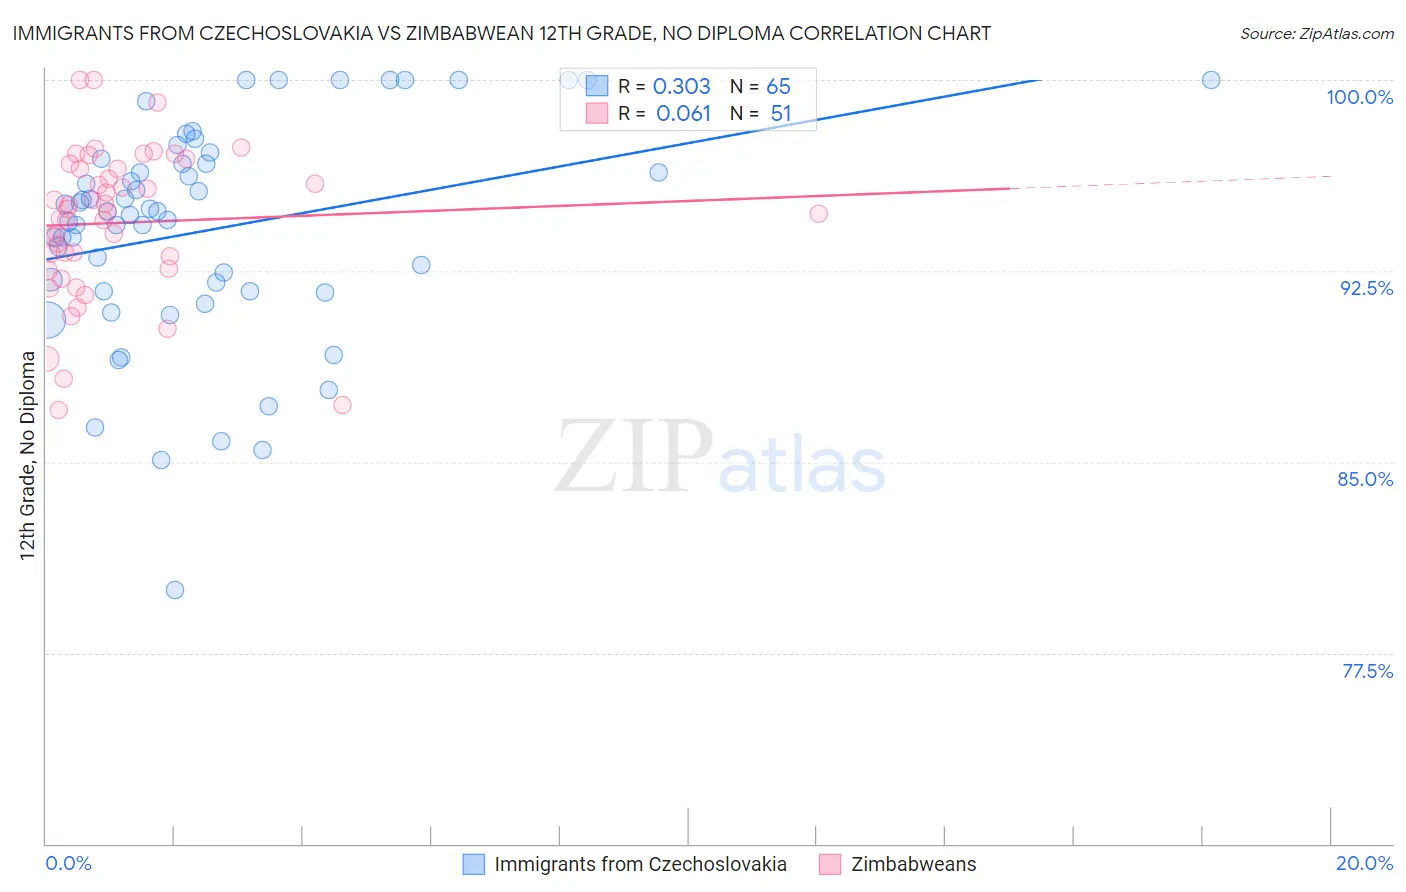
Immigrants from Czechoslovakia vs Zimbabwean 12th Grade, No Diploma Correlation Chart
The statistical analysis conducted on geographies consisting of 195,448,106 people shows a mild positive correlation between the proportion of Immigrants from Czechoslovakia and percentage of population with at least 12th grade (no diploma) education in the United States with a correlation coefficient (R) of 0.303 and weighted average of 92.7%. Similarly, the statistical analysis conducted on geographies consisting of 69,203,423 people shows a slight positive correlation between the proportion of Zimbabweans and percentage of population with at least 12th grade (no diploma) education in the United States with a correlation coefficient (R) of 0.061 and weighted average of 92.7%, a difference of 0.070%.
12th Grade, No Diploma Correlation Summary
| Measurement | Immigrants from Czechoslovakia | Zimbabwean |
| Minimum | 80.0% | 87.0% |
| Maximum | 100.0% | 100.0% |
| Range | 20.0% | 13.0% |
| Mean | 94.1% | 94.4% |
| Median | 94.8% | 94.8% |
| Interquartile 25% (IQ1) | 91.7% | 92.6% |
| Interquartile 75% (IQ3) | 96.8% | 96.5% |
| Interquartile Range (IQR) | 5.1% | 3.9% |
| Standard Deviation (Sample) | 4.3% | 2.9% |
| Standard Deviation (Population) | 4.3% | 2.9% |
Demographics Similar to Immigrants from Czechoslovakia and Zimbabweans by 12th Grade, No Diploma
In terms of 12th grade, no diploma, the demographic groups most similar to Immigrants from Czechoslovakia are Immigrants from Iran (92.7%, a difference of 0.0%), Immigrants from South Africa (92.7%, a difference of 0.010%), Czechoslovakian (92.6%, a difference of 0.010%), Immigrants from Latvia (92.6%, a difference of 0.020%), and Immigrants from South Central Asia (92.6%, a difference of 0.030%). Similarly, the demographic groups most similar to Zimbabweans are Immigrants from Netherlands (92.7%, a difference of 0.0%), Austrian (92.7%, a difference of 0.010%), Ukrainian (92.7%, a difference of 0.020%), Soviet Union (92.7%, a difference of 0.030%), and Immigrants from Japan (92.8%, a difference of 0.040%).
| Demographics | Rating | Rank | 12th Grade, No Diploma |
| Welsh | 99.7 /100 | #55 | Exceptional 92.8% |
| New Zealanders | 99.7 /100 | #56 | Exceptional 92.8% |
| Immigrants | Canada | 99.7 /100 | #57 | Exceptional 92.8% |
| Immigrants | Taiwan | 99.7 /100 | #58 | Exceptional 92.8% |
| Immigrants | North America | 99.7 /100 | #59 | Exceptional 92.8% |
| Slavs | 99.7 /100 | #60 | Exceptional 92.8% |
| Immigrants | Japan | 99.7 /100 | #61 | Exceptional 92.8% |
| Ukrainians | 99.6 /100 | #62 | Exceptional 92.7% |
| Zimbabweans | 99.6 /100 | #63 | Exceptional 92.7% |
| Immigrants | Netherlands | 99.6 /100 | #64 | Exceptional 92.7% |
| Austrians | 99.6 /100 | #65 | Exceptional 92.7% |
| Soviet Union | 99.6 /100 | #66 | Exceptional 92.7% |
| Immigrants | South Africa | 99.5 /100 | #67 | Exceptional 92.7% |
| Immigrants | Czechoslovakia | 99.5 /100 | #68 | Exceptional 92.7% |
| Immigrants | Iran | 99.5 /100 | #69 | Exceptional 92.7% |
| Czechoslovakians | 99.5 /100 | #70 | Exceptional 92.6% |
| Immigrants | Latvia | 99.5 /100 | #71 | Exceptional 92.6% |
| Immigrants | South Central Asia | 99.5 /100 | #72 | Exceptional 92.6% |
| Burmese | 99.4 /100 | #73 | Exceptional 92.6% |
| Immigrants | Moldova | 99.4 /100 | #74 | Exceptional 92.6% |
| Native Hawaiians | 99.4 /100 | #75 | Exceptional 92.6% |