Immigrants from Czechoslovakia vs Yaqui 10th Grade

COMPARE

Immigrants from Czechoslovakia
Race
Ancestry
AfghanAfricanAlaska NativeAlaskan AthabascanAlbanianAleutAlsatianAmericanApacheArabArapahoArgentineanArmenianAssyrian/Chaldean/SyriacAustralianAustrianBahamianBangladeshiBarbadianBasqueBelgianBelizeanBermudanBhutaneseBlackfeetBolivianBrazilianBritishBritish West IndianBulgarianBurmeseCajunCambodianCanadianCape VerdeanCarpatho RusynCelticCentral AmericanCentral American IndianCherokeeCheyenneChickasawChileanChineseChippewaChoctawColombianColvilleComancheCosta RicanCreeCreekCroatianCrowCubanCypriotCzechCzechoslovakianDanishDelawareDominicanDutchDutch West IndianEastern EuropeanEcuadorianEgyptianEnglishEstonianEthiopianEuropeanFijianFilipinoFinnishFrenchFrench American IndianFrench CanadianGermanGerman RussianGhanaianGreekGuamanian/ChamorroGuatemalanGuyaneseHaitianHmongHonduranHopiHoumaHungarianIcelanderIndian (Asian)IndonesianInupiatIranianIraqiIrishIroquoisIsraeliItalianJamaicanJapaneseJordanianKenyanKiowaKoreanLaotianLatvianLebaneseLiberianLithuanianLumbeeLuxembourgerMacedonianMalaysianMalteseMarshalleseMenomineeMexicanMexican American IndianMongolianMoroccanNative HawaiianNavajoNepaleseNew ZealanderNicaraguanNigerianNorthern EuropeanNorwegianOkinawanOsageOttawaPaiutePakistaniPalestinianPanamanianParaguayanPennsylvania GermanPeruvianPimaPolishPortuguesePotawatomiPuebloPuerto RicanPuget Sound SalishRomanianRussianSalvadoranSamoanScandinavianScotch-IrishScottishSeminoleSenegaleseSerbianShoshoneSierra LeoneanSiouxSlavicSlovakSloveneSomaliSouth AfricanSouth AmericanSouth American IndianSoviet UnionSpaniardSpanishSpanish AmericanSpanish American IndianSri LankanSubsaharan AfricanSudaneseSwedishSwissSyrianTaiwaneseThaiTlingit-HaidaTohono O'OdhamTonganTrinidadian and TobagonianTsimshianTurkishU.S. Virgin IslanderUgandanUkrainianUruguayanUteVenezuelanVietnameseWelshWest IndianYakamaYugoslavianYumanYup'ikZimbabwean
Immigration
NonimmigrantsImmigrantsAfghanistanAfricaAlbaniaArgentinaArmeniaAsiaAustraliaAustriaBahamasBangladeshBarbadosBelarusBelgiumBelizeBoliviaBosnia and HerzegovinaBrazilBulgariaBurma/MyanmarCabo VerdeCambodiaCameroonCanadaCaribbeanCentral AmericaChileChinaColombiaCongoCosta RicaCroatiaCubaCzechoslovakiaDenmarkDominicaDominican RepublicEastern AfricaEastern AsiaEastern EuropeEcuadorEgyptEl SalvadorEnglandEritreaEthiopiaEuropeFijiFranceGermanyGhanaGreeceGrenadaGuatemalaGuyanaHaitiHondurasHong KongHungaryIndiaIndonesiaIranIraqIrelandIsraelItalyJamaicaJapanJordanKazakhstanKenyaKoreaKuwaitLaosLatin AmericaLatviaLebanonLiberiaLithuaniaMalaysiaMexicoMicronesiaMiddle AfricaMoldovaMoroccoNepalNetherlandsNicaraguaNigeriaNorth AmericaNorth MacedoniaNorthern AfricaNorthern EuropeNorwayOceaniaPakistanPanamaPeruPhilippinesPolandPortugalRomaniaRussiaSaudi ArabiaScotlandSenegalSerbiaSierra LeoneSingaporeSomaliaSouth AfricaSouth AmericaSouth Central AsiaSouth Eastern AsiaSouthern EuropeSpainSri LankaSt. Vincent and the GrenadinesSudanSwedenSwitzerlandSyriaTaiwanThailandTrinidad and TobagoTurkeyUgandaUkraineUruguayUzbekistanVenezuelaVietnamWest IndiesWestern AfricaWestern AsiaWestern EuropeYemenZaireZimbabweAzores
Yaqui
Race
Ancestry
AfghanAfricanAlaska NativeAlaskan AthabascanAlbanianAleutAlsatianAmericanApacheArabArapahoArgentineanArmenianAssyrian/Chaldean/SyriacAustralianAustrianBahamianBangladeshiBarbadianBasqueBelgianBelizeanBermudanBhutaneseBlackfeetBolivianBrazilianBritishBritish West IndianBulgarianBurmeseCajunCambodianCanadianCape VerdeanCarpatho RusynCelticCentral AmericanCentral American IndianCherokeeCheyenneChickasawChileanChineseChippewaChoctawColombianColvilleComancheCosta RicanCreeCreekCroatianCrowCubanCypriotCzechCzechoslovakianDanishDelawareDominicanDutchDutch West IndianEastern EuropeanEcuadorianEgyptianEnglishEstonianEthiopianEuropeanFijianFilipinoFinnishFrenchFrench American IndianFrench CanadianGermanGerman RussianGhanaianGreekGuamanian/ChamorroGuatemalanGuyaneseHaitianHmongHonduranHopiHoumaHungarianIcelanderIndian (Asian)IndonesianInupiatIranianIraqiIrishIroquoisIsraeliItalianJamaicanJapaneseJordanianKenyanKiowaKoreanLaotianLatvianLebaneseLiberianLithuanianLumbeeLuxembourgerMacedonianMalaysianMalteseMarshalleseMenomineeMexicanMexican American IndianMongolianMoroccanNative HawaiianNavajoNepaleseNew ZealanderNicaraguanNigerianNorthern EuropeanNorwegianOkinawanOsageOttawaPaiutePakistaniPalestinianPanamanianParaguayanPennsylvania GermanPeruvianPimaPolishPortuguesePotawatomiPuebloPuerto RicanPuget Sound SalishRomanianRussianSalvadoranSamoanScandinavianScotch-IrishScottishSeminoleSenegaleseSerbianShoshoneSierra LeoneanSiouxSlavicSlovakSloveneSomaliSouth AfricanSouth AmericanSouth American IndianSoviet UnionSpaniardSpanishSpanish AmericanSpanish American IndianSri LankanSubsaharan AfricanSudaneseSwedishSwissSyrianTaiwaneseThaiTlingit-HaidaTohono O'OdhamTonganTrinidadian and TobagonianTsimshianTurkishU.S. Virgin IslanderUgandanUkrainianUruguayanUteVenezuelanVietnameseWelshWest IndianYakamaYaquiYugoslavianYumanYup'ikZimbabwean
Immigration
NonimmigrantsImmigrantsAfghanistanAfricaAlbaniaArgentinaArmeniaAsiaAustraliaAustriaBahamasBangladeshBarbadosBelarusBelgiumBelizeBoliviaBosnia and HerzegovinaBrazilBulgariaBurma/MyanmarCabo VerdeCambodiaCameroonCanadaCaribbeanCentral AmericaChileChinaColombiaCongoCosta RicaCroatiaCubaDenmarkDominicaDominican RepublicEastern AfricaEastern AsiaEastern EuropeEcuadorEgyptEl SalvadorEnglandEritreaEthiopiaEuropeFijiFranceGermanyGhanaGreeceGrenadaGuatemalaGuyanaHaitiHondurasHong KongHungaryIndiaIndonesiaIranIraqIrelandIsraelItalyJamaicaJapanJordanKazakhstanKenyaKoreaKuwaitLaosLatin AmericaLatviaLebanonLiberiaLithuaniaMalaysiaMexicoMicronesiaMiddle AfricaMoldovaMoroccoNepalNetherlandsNicaraguaNigeriaNorth AmericaNorth MacedoniaNorthern AfricaNorthern EuropeNorwayOceaniaPakistanPanamaPeruPhilippinesPolandPortugalRomaniaRussiaSaudi ArabiaScotlandSenegalSerbiaSierra LeoneSingaporeSomaliaSouth AfricaSouth AmericaSouth Central AsiaSouth Eastern AsiaSouthern EuropeSpainSri LankaSt. Vincent and the GrenadinesSudanSwedenSwitzerlandSyriaTaiwanThailandTrinidad and TobagoTurkeyUgandaUkraineUruguayUzbekistanVenezuelaVietnamWest IndiesWestern AfricaWestern AsiaWestern EuropeYemenZaireZimbabweAzores
10th Grade
Income
Poverty
Unemployment
Labor Participation
Family Structure
Vehicle Availability
Education Level
Disability

10th Grade Comparison

Immigrants from Czechoslovakia

Yaqui

Exceptional
Tragic
94.7%
10TH GRADE
99.2/ 100
METRIC RATING
79th/ 347
METRIC RANK
91.1%
10TH GRADE
0.0/ 100
METRIC RATING
306th/ 347
METRIC RANK

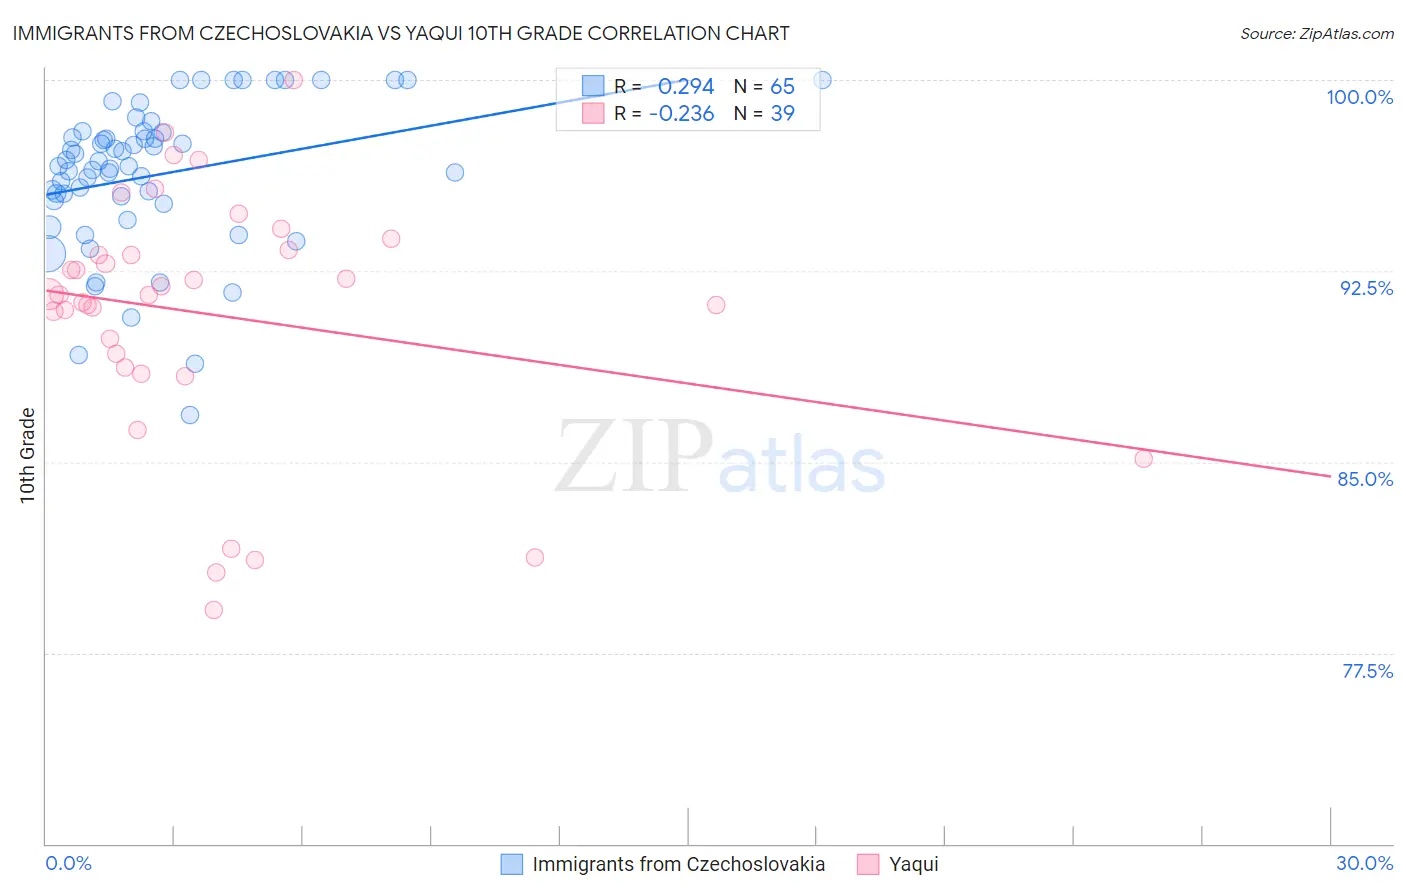
Immigrants from Czechoslovakia vs Yaqui 10th Grade Correlation Chart

The statistical analysis conducted on geographies consisting of 195,448,106 people shows a weak positive correlation between the proportion of Immigrants from Czechoslovakia and percentage of population with at least 10th grade education in the United States with a correlation coefficient (R) of 0.294 and weighted average of 94.7%. Similarly, the statistical analysis conducted on geographies consisting of 107,725,021 people shows a weak negative correlation between the proportion of Yaqui and percentage of population with at least 10th grade education in the United States with a correlation coefficient (R) of -0.236 and weighted average of 91.1%, a difference of 4.0%.
Immigrants from Czechoslovakia vs Yaqui 10th Grade

10th Grade Correlation Summary

MeasurementImmigrants from CzechoslovakiaYaqui
Minimum86.9%79.2%
Maximum100.0%100.0%
Range13.1%20.8%
Mean96.3%90.8%
Median96.6%91.6%
Interquartile 25% (IQ1)95.2%88.7%
Interquartile 75% (IQ3)98.0%93.3%
Interquartile Range (IQR)2.8%4.7%
Standard Deviation (Sample)2.9%4.9%
Standard Deviation (Population)2.9%4.8%

Similar Demographics by 10th Grade

Demographics Similar to Immigrants from Czechoslovakia by 10th Grade

In terms of 10th grade, the demographic groups most similar to Immigrants from Czechoslovakia are Immigrants from Denmark (94.7%, a difference of 0.010%), Immigrants from Latvia (94.7%, a difference of 0.010%), Filipino (94.8%, a difference of 0.030%), Swiss (94.7%, a difference of 0.040%), and Immigrants from Western Europe (94.7%, a difference of 0.040%).
DemographicsRating | Rank10th Grade
Immigrants | Sweden
99.6
/100
|
#72
Exceptional
94.9%
Bhutanese
99.6
/100
|
#73
Exceptional
94.9%
Canadians
99.6
/100
|
#74
Exceptional
94.9%
Okinawans
99.5
/100
|
#75
Exceptional
94.8%
Romanians
99.5
/100
|
#76
Exceptional
94.8%
Immigrants | South Africa
99.5
/100
|
#77
Exceptional
94.8%
Filipinos
99.3
/100
|
#78
Exceptional
94.8%
Immigrants | Czechoslovakia
99.2
/100
|
#79
Exceptional
94.7%
Immigrants | Denmark
99.2
/100
|
#80
Exceptional
94.7%
Immigrants | Latvia
99.2
/100
|
#81
Exceptional
94.7%
Swiss
99.1
/100
|
#82
Exceptional
94.7%
Immigrants | Western Europe
99.1
/100
|
#83
Exceptional
94.7%
Icelanders
99.1
/100
|
#84
Exceptional
94.7%
Crow
99.0
/100
|
#85
Exceptional
94.7%
Puget Sound Salish
99.0
/100
|
#86
Exceptional
94.7%

Demographics Similar to Yaqui by 10th Grade

In terms of 10th grade, the demographic groups most similar to Yaqui are Immigrants from Dominica (91.1%, a difference of 0.060%), Immigrants from Fiji (91.0%, a difference of 0.060%), Immigrants from Bangladesh (91.0%, a difference of 0.070%), Pima (91.2%, a difference of 0.080%), and Immigrants (91.0%, a difference of 0.11%).
DemographicsRating | Rank10th Grade
Immigrants | Haiti
0.0
/100
|
#299
Tragic
91.4%
Guyanese
0.0
/100
|
#300
Tragic
91.4%
Japanese
0.0
/100
|
#301
Tragic
91.2%
Immigrants | Guyana
0.0
/100
|
#302
Tragic
91.2%
Immigrants | Vietnam
0.0
/100
|
#303
Tragic
91.2%
Pima
0.0
/100
|
#304
Tragic
91.2%
Immigrants | Dominica
0.0
/100
|
#305
Tragic
91.1%
Yaqui
0.0
/100
|
#306
Tragic
91.1%
Immigrants | Fiji
0.0
/100
|
#307
Tragic
91.0%
Immigrants | Bangladesh
0.0
/100
|
#308
Tragic
91.0%
Immigrants | Immigrants
0.0
/100
|
#309
Tragic
91.0%
Vietnamese
0.0
/100
|
#310
Tragic
90.9%
Immigrants | Cambodia
0.0
/100
|
#311
Tragic
90.9%
Immigrants | Portugal
0.0
/100
|
#312
Tragic
90.8%
Cape Verdeans
0.0
/100
|
#313
Tragic
90.8%