Immigrants from Czechoslovakia vs Soviet Union Nursery School
COMPARE
Immigrants from Czechoslovakia
Soviet Union
Nursery School
Nursery School Comparison
Immigrants from Czechoslovakia
Soviet Union
98.2%
NURSERY SCHOOL
96.8/ 100
METRIC RATING
111th/ 347
METRIC RANK
98.0%
NURSERY SCHOOL
71.6/ 100
METRIC RATING
151st/ 347
METRIC RANK
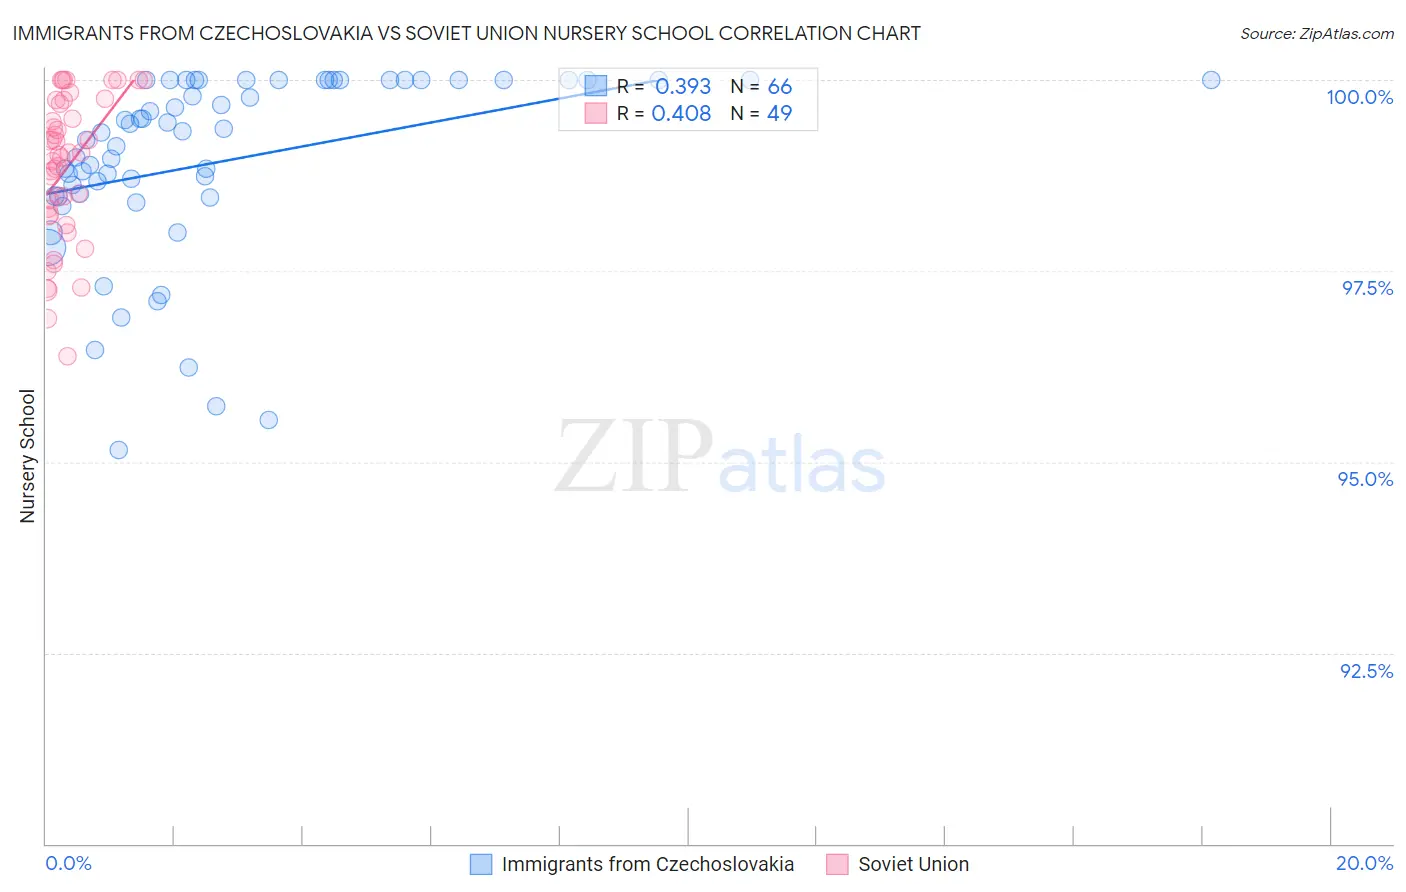
Immigrants from Czechoslovakia vs Soviet Union Nursery School Correlation Chart
The statistical analysis conducted on geographies consisting of 195,448,060 people shows a mild positive correlation between the proportion of Immigrants from Czechoslovakia and percentage of population with at least nursery school education in the United States with a correlation coefficient (R) of 0.393 and weighted average of 98.2%. Similarly, the statistical analysis conducted on geographies consisting of 43,454,395 people shows a moderate positive correlation between the proportion of Soviet Union and percentage of population with at least nursery school education in the United States with a correlation coefficient (R) of 0.408 and weighted average of 98.0%, a difference of 0.19%.
Nursery School Correlation Summary
| Measurement | Immigrants from Czechoslovakia | Soviet Union |
| Minimum | 95.2% | 96.4% |
| Maximum | 100.0% | 100.0% |
| Range | 4.8% | 3.6% |
| Mean | 98.9% | 98.8% |
| Median | 99.3% | 99.0% |
| Interquartile 25% (IQ1) | 98.5% | 98.2% |
| Interquartile 75% (IQ3) | 100.0% | 99.7% |
| Interquartile Range (IQR) | 1.5% | 1.5% |
| Standard Deviation (Sample) | 1.2% | 0.95% |
| Standard Deviation (Population) | 1.2% | 0.94% |
Similar Demographics by Nursery School
Demographics Similar to Immigrants from Czechoslovakia by Nursery School
In terms of nursery school, the demographic groups most similar to Immigrants from Czechoslovakia are Immigrants from Singapore (98.2%, a difference of 0.0%), Bhutanese (98.2%, a difference of 0.010%), Turkish (98.2%, a difference of 0.010%), Immigrants from Switzerland (98.2%, a difference of 0.010%), and Basque (98.2%, a difference of 0.010%).
| Demographics | Rating | Rank | Nursery School |
| Bhutanese | 97.4 /100 | #104 | Exceptional 98.2% |
| Turks | 97.4 /100 | #105 | Exceptional 98.2% |
| Immigrants | Switzerland | 97.3 /100 | #106 | Exceptional 98.2% |
| Basques | 97.3 /100 | #107 | Exceptional 98.2% |
| Pima | 97.1 /100 | #108 | Exceptional 98.2% |
| German Russians | 97.1 /100 | #109 | Exceptional 98.2% |
| Immigrants | Singapore | 96.9 /100 | #110 | Exceptional 98.2% |
| Immigrants | Czechoslovakia | 96.8 /100 | #111 | Exceptional 98.2% |
| Immigrants | Norway | 96.6 /100 | #112 | Exceptional 98.2% |
| Immigrants | Latvia | 96.4 /100 | #113 | Exceptional 98.2% |
| Ute | 96.4 /100 | #114 | Exceptional 98.2% |
| Iranians | 96.3 /100 | #115 | Exceptional 98.2% |
| Spanish | 95.8 /100 | #116 | Exceptional 98.2% |
| Immigrants | France | 95.6 /100 | #117 | Exceptional 98.2% |
| Yugoslavians | 95.4 /100 | #118 | Exceptional 98.2% |
Demographics Similar to Soviet Union by Nursery School
In terms of nursery school, the demographic groups most similar to Soviet Union are Jordanian (98.1%, a difference of 0.0%), Immigrants from Greece (98.1%, a difference of 0.010%), Apache (98.1%, a difference of 0.010%), Dutch West Indian (98.0%, a difference of 0.010%), and Immigrants from Moldova (98.0%, a difference of 0.010%).
| Demographics | Rating | Rank | Nursery School |
| Alsatians | 80.3 /100 | #144 | Excellent 98.1% |
| Immigrants | Israel | 78.5 /100 | #145 | Good 98.1% |
| Filipinos | 78.5 /100 | #146 | Good 98.1% |
| Hmong | 75.7 /100 | #147 | Good 98.1% |
| Immigrants | Greece | 75.4 /100 | #148 | Good 98.1% |
| Apache | 73.2 /100 | #149 | Good 98.1% |
| Jordanians | 72.9 /100 | #150 | Good 98.1% |
| Soviet Union | 71.6 /100 | #151 | Good 98.0% |
| Dutch West Indians | 70.2 /100 | #152 | Good 98.0% |
| Immigrants | Moldova | 69.6 /100 | #153 | Good 98.0% |
| Immigrants | Iran | 68.7 /100 | #154 | Good 98.0% |
| Immigrants | South Central Asia | 66.7 /100 | #155 | Good 98.0% |
| Venezuelans | 66.6 /100 | #156 | Good 98.0% |
| Comanche | 66.0 /100 | #157 | Good 98.0% |
| Immigrants | North Macedonia | 65.7 /100 | #158 | Good 98.0% |