Immigrants from Czechoslovakia vs French American Indian 1st Grade

COMPARE

Immigrants from Czechoslovakia
Race
Ancestry
AfghanAfricanAlaska NativeAlaskan AthabascanAlbanianAleutAlsatianAmericanApacheArabArapahoArgentineanArmenianAssyrian/Chaldean/SyriacAustralianAustrianBahamianBangladeshiBarbadianBasqueBelgianBelizeanBermudanBhutaneseBlackfeetBolivianBrazilianBritishBritish West IndianBulgarianBurmeseCajunCambodianCanadianCape VerdeanCarpatho RusynCelticCentral AmericanCentral American IndianCherokeeCheyenneChickasawChileanChineseChippewaChoctawColombianColvilleComancheCosta RicanCreeCreekCroatianCrowCubanCypriotCzechCzechoslovakianDanishDelawareDominicanDutchDutch West IndianEastern EuropeanEcuadorianEgyptianEnglishEstonianEthiopianEuropeanFijianFilipinoFinnishFrenchFrench CanadianGermanGerman RussianGhanaianGreekGuamanian/ChamorroGuatemalanGuyaneseHaitianHmongHonduranHopiHoumaHungarianIcelanderIndian (Asian)IndonesianInupiatIranianIraqiIrishIroquoisIsraeliItalianJamaicanJapaneseJordanianKenyanKiowaKoreanLaotianLatvianLebaneseLiberianLithuanianLumbeeLuxembourgerMacedonianMalaysianMalteseMarshalleseMenomineeMexicanMexican American IndianMongolianMoroccanNative HawaiianNavajoNepaleseNew ZealanderNicaraguanNigerianNorthern EuropeanNorwegianOkinawanOsageOttawaPaiutePakistaniPalestinianPanamanianParaguayanPennsylvania GermanPeruvianPimaPolishPortuguesePotawatomiPuebloPuerto RicanPuget Sound SalishRomanianRussianSalvadoranSamoanScandinavianScotch-IrishScottishSeminoleSenegaleseSerbianShoshoneSierra LeoneanSiouxSlavicSlovakSloveneSomaliSouth AfricanSouth AmericanSouth American IndianSoviet UnionSpaniardSpanishSpanish AmericanSpanish American IndianSri LankanSubsaharan AfricanSudaneseSwedishSwissSyrianTaiwaneseThaiTlingit-HaidaTohono O'OdhamTonganTrinidadian and TobagonianTsimshianTurkishU.S. Virgin IslanderUgandanUkrainianUruguayanUteVenezuelanVietnameseWelshWest IndianYakamaYaquiYugoslavianYumanYup'ikZimbabwean
Immigration
NonimmigrantsImmigrantsAfghanistanAfricaAlbaniaArgentinaArmeniaAsiaAustraliaAustriaBahamasBangladeshBarbadosBelarusBelgiumBelizeBoliviaBosnia and HerzegovinaBrazilBulgariaBurma/MyanmarCabo VerdeCambodiaCameroonCanadaCaribbeanCentral AmericaChileChinaColombiaCongoCosta RicaCroatiaCubaCzechoslovakiaDenmarkDominicaDominican RepublicEastern AfricaEastern AsiaEastern EuropeEcuadorEgyptEl SalvadorEnglandEritreaEthiopiaEuropeFijiFranceGermanyGhanaGreeceGrenadaGuatemalaGuyanaHaitiHondurasHong KongHungaryIndiaIndonesiaIranIraqIrelandIsraelItalyJamaicaJapanJordanKazakhstanKenyaKoreaKuwaitLaosLatin AmericaLatviaLebanonLiberiaLithuaniaMalaysiaMexicoMicronesiaMiddle AfricaMoldovaMoroccoNepalNetherlandsNicaraguaNigeriaNorth AmericaNorth MacedoniaNorthern AfricaNorthern EuropeNorwayOceaniaPakistanPanamaPeruPhilippinesPolandPortugalRomaniaRussiaSaudi ArabiaScotlandSenegalSerbiaSierra LeoneSingaporeSomaliaSouth AfricaSouth AmericaSouth Central AsiaSouth Eastern AsiaSouthern EuropeSpainSri LankaSt. Vincent and the GrenadinesSudanSwedenSwitzerlandSyriaTaiwanThailandTrinidad and TobagoTurkeyUgandaUkraineUruguayUzbekistanVenezuelaVietnamWest IndiesWestern AfricaWestern AsiaWestern EuropeYemenZaireZimbabweAzores
French American Indian
Race
Ancestry
AfghanAfricanAlaska NativeAlaskan AthabascanAlbanianAleutAlsatianAmericanApacheArabArapahoArgentineanArmenianAssyrian/Chaldean/SyriacAustralianAustrianBahamianBangladeshiBarbadianBasqueBelgianBelizeanBermudanBhutaneseBlackfeetBolivianBrazilianBritishBritish West IndianBulgarianBurmeseCajunCambodianCanadianCape VerdeanCarpatho RusynCelticCentral AmericanCentral American IndianCherokeeCheyenneChickasawChileanChineseChippewaChoctawColombianColvilleComancheCosta RicanCreeCreekCroatianCrowCubanCypriotCzechCzechoslovakianDanishDelawareDominicanDutchDutch West IndianEastern EuropeanEcuadorianEgyptianEnglishEstonianEthiopianEuropeanFijianFilipinoFinnishFrenchFrench American IndianFrench CanadianGermanGerman RussianGhanaianGreekGuamanian/ChamorroGuatemalanGuyaneseHaitianHmongHonduranHopiHoumaHungarianIcelanderIndian (Asian)IndonesianInupiatIranianIraqiIrishIroquoisIsraeliItalianJamaicanJapaneseJordanianKenyanKiowaKoreanLaotianLatvianLebaneseLiberianLithuanianLumbeeLuxembourgerMacedonianMalaysianMalteseMarshalleseMenomineeMexicanMexican American IndianMongolianMoroccanNative HawaiianNavajoNepaleseNew ZealanderNicaraguanNigerianNorthern EuropeanNorwegianOkinawanOsageOttawaPaiutePakistaniPalestinianPanamanianParaguayanPennsylvania GermanPeruvianPimaPolishPortuguesePotawatomiPuebloPuerto RicanPuget Sound SalishRomanianRussianSalvadoranSamoanScandinavianScotch-IrishScottishSeminoleSenegaleseSerbianShoshoneSierra LeoneanSiouxSlavicSlovakSloveneSomaliSouth AfricanSouth AmericanSouth American IndianSoviet UnionSpaniardSpanishSpanish AmericanSpanish American IndianSri LankanSubsaharan AfricanSudaneseSwedishSwissSyrianTaiwaneseThaiTlingit-HaidaTohono O'OdhamTonganTrinidadian and TobagonianTsimshianTurkishU.S. Virgin IslanderUgandanUkrainianUruguayanUteVenezuelanVietnameseWelshWest IndianYakamaYaquiYugoslavianYumanYup'ikZimbabwean
Immigration
NonimmigrantsImmigrantsAfghanistanAfricaAlbaniaArgentinaArmeniaAsiaAustraliaAustriaBahamasBangladeshBarbadosBelarusBelgiumBelizeBoliviaBosnia and HerzegovinaBrazilBulgariaBurma/MyanmarCabo VerdeCambodiaCameroonCanadaCaribbeanCentral AmericaChileChinaColombiaCongoCosta RicaCroatiaCubaDenmarkDominicaDominican RepublicEastern AfricaEastern AsiaEastern EuropeEcuadorEgyptEl SalvadorEnglandEritreaEthiopiaEuropeFijiFranceGermanyGhanaGreeceGrenadaGuatemalaGuyanaHaitiHondurasHong KongHungaryIndiaIndonesiaIranIraqIrelandIsraelItalyJamaicaJapanJordanKazakhstanKenyaKoreaKuwaitLaosLatin AmericaLatviaLebanonLiberiaLithuaniaMalaysiaMexicoMicronesiaMiddle AfricaMoldovaMoroccoNepalNetherlandsNicaraguaNigeriaNorth AmericaNorth MacedoniaNorthern AfricaNorthern EuropeNorwayOceaniaPakistanPanamaPeruPhilippinesPolandPortugalRomaniaRussiaSaudi ArabiaScotlandSenegalSerbiaSierra LeoneSingaporeSomaliaSouth AfricaSouth AmericaSouth Central AsiaSouth Eastern AsiaSouthern EuropeSpainSri LankaSt. Vincent and the GrenadinesSudanSwedenSwitzerlandSyriaTaiwanThailandTrinidad and TobagoTurkeyUgandaUkraineUruguayUzbekistanVenezuelaVietnamWest IndiesWestern AfricaWestern AsiaWestern EuropeYemenZaireZimbabweAzores
1st Grade
Income
Poverty
Unemployment
Labor Participation
Family Structure
Vehicle Availability
Education Level
Disability

1st Grade Comparison

Immigrants from Czechoslovakia

French American Indians

Exceptional
Good
98.2%
1ST GRADE
96.6/ 100
METRIC RATING
111th/ 347
METRIC RANK
98.0%
1ST GRADE
63.7/ 100
METRIC RATING
159th/ 347
METRIC RANK

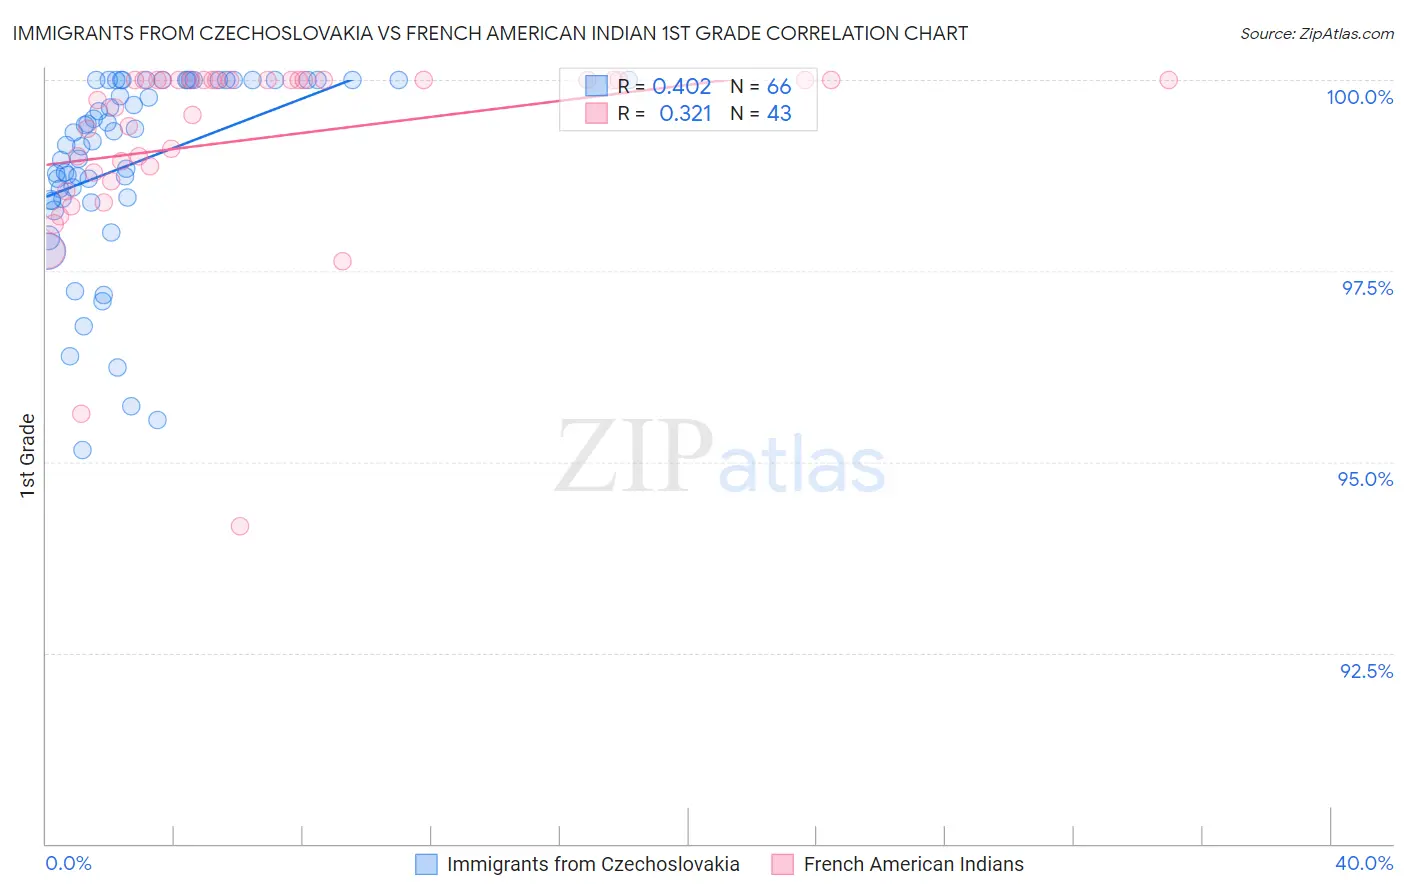
Immigrants from Czechoslovakia vs French American Indian 1st Grade Correlation Chart

The statistical analysis conducted on geographies consisting of 195,448,060 people shows a moderate positive correlation between the proportion of Immigrants from Czechoslovakia and percentage of population with at least 1st grade education in the United States with a correlation coefficient (R) of 0.402 and weighted average of 98.2%. Similarly, the statistical analysis conducted on geographies consisting of 131,974,854 people shows a mild positive correlation between the proportion of French American Indians and percentage of population with at least 1st grade education in the United States with a correlation coefficient (R) of 0.321 and weighted average of 98.0%, a difference of 0.22%.
Immigrants from Czechoslovakia vs French American Indian 1st Grade

1st Grade Correlation Summary

MeasurementImmigrants from CzechoslovakiaFrench American Indian
Minimum95.2%94.2%
Maximum100.0%100.0%
Range4.8%5.8%
Mean98.9%99.2%
Median99.3%100.0%
Interquartile 25% (IQ1)98.4%98.8%
Interquartile 75% (IQ3)100.0%100.0%
Interquartile Range (IQR)1.6%1.2%
Standard Deviation (Sample)1.2%1.2%
Standard Deviation (Population)1.2%1.2%

Similar Demographics by 1st Grade

Demographics Similar to Immigrants from Czechoslovakia by 1st Grade

In terms of 1st grade, the demographic groups most similar to Immigrants from Czechoslovakia are Immigrants from Singapore (98.2%, a difference of 0.0%), Immigrants from Norway (98.2%, a difference of 0.0%), German Russian (98.2%, a difference of 0.010%), Immigrants from Latvia (98.2%, a difference of 0.010%), and Ute (98.2%, a difference of 0.010%).
DemographicsRating | Rank1st Grade
Pima
97.5
/100
|
#104
Exceptional
98.2%
Basques
97.4
/100
|
#105
Exceptional
98.2%
Turks
97.4
/100
|
#106
Exceptional
98.2%
Immigrants | Switzerland
97.3
/100
|
#107
Exceptional
98.2%
Bhutanese
97.3
/100
|
#108
Exceptional
98.2%
German Russians
97.1
/100
|
#109
Exceptional
98.2%
Immigrants | Singapore
96.7
/100
|
#110
Exceptional
98.2%
Immigrants | Czechoslovakia
96.6
/100
|
#111
Exceptional
98.2%
Immigrants | Norway
96.6
/100
|
#112
Exceptional
98.2%
Immigrants | Latvia
96.4
/100
|
#113
Exceptional
98.2%
Ute
96.2
/100
|
#114
Exceptional
98.2%
Iranians
96.0
/100
|
#115
Exceptional
98.2%
Spanish
95.9
/100
|
#116
Exceptional
98.2%
Yugoslavians
95.5
/100
|
#117
Exceptional
98.2%
Immigrants | France
95.5
/100
|
#118
Exceptional
98.2%

Demographics Similar to French American Indians by 1st Grade

In terms of 1st grade, the demographic groups most similar to French American Indians are Venezuelan (98.0%, a difference of 0.0%), Immigrants from Iran (98.0%, a difference of 0.010%), Comanche (98.0%, a difference of 0.010%), Immigrants from South Central Asia (98.0%, a difference of 0.010%), and Immigrants from North Macedonia (98.0%, a difference of 0.010%).
DemographicsRating | Rank1st Grade
Immigrants | Moldova
69.5
/100
|
#152
Good
98.0%
Soviet Union
68.9
/100
|
#153
Good
98.0%
Immigrants | Iran
66.9
/100
|
#154
Good
98.0%
Comanche
66.9
/100
|
#155
Good
98.0%
Immigrants | South Central Asia
66.2
/100
|
#156
Good
98.0%
Immigrants | North Macedonia
65.3
/100
|
#157
Good
98.0%
Venezuelans
64.7
/100
|
#158
Good
98.0%
French American Indians
63.7
/100
|
#159
Good
98.0%
Immigrants | Russia
59.2
/100
|
#160
Average
97.9%
Immigrants | Italy
59.1
/100
|
#161
Average
97.9%
Immigrants | Eastern Europe
58.9
/100
|
#162
Average
97.9%
Spanish Americans
57.7
/100
|
#163
Average
97.9%
Brazilians
57.6
/100
|
#164
Average
97.9%
Ugandans
56.9
/100
|
#165
Average
97.9%
Navajo
56.6
/100
|
#166
Average
97.9%