Immigrants from Croatia vs South American High School Diploma

COMPARE

Immigrants from Croatia
Race
Ancestry
AfghanAfricanAlaska NativeAlaskan AthabascanAlbanianAleutAlsatianAmericanApacheArabArapahoArgentineanArmenianAssyrian/Chaldean/SyriacAustralianAustrianBahamianBangladeshiBarbadianBasqueBelgianBelizeanBermudanBhutaneseBlackfeetBolivianBrazilianBritishBritish West IndianBulgarianBurmeseCajunCambodianCanadianCape VerdeanCarpatho RusynCelticCentral AmericanCentral American IndianCherokeeCheyenneChickasawChileanChineseChippewaChoctawColombianColvilleComancheCosta RicanCreeCreekCroatianCrowCubanCypriotCzechCzechoslovakianDanishDelawareDominicanDutchDutch West IndianEastern EuropeanEcuadorianEgyptianEnglishEstonianEthiopianEuropeanFijianFilipinoFinnishFrenchFrench American IndianFrench CanadianGermanGerman RussianGhanaianGreekGuamanian/ChamorroGuatemalanGuyaneseHaitianHmongHonduranHopiHoumaHungarianIcelanderIndian (Asian)IndonesianInupiatIranianIraqiIrishIroquoisIsraeliItalianJamaicanJapaneseJordanianKenyanKiowaKoreanLaotianLatvianLebaneseLiberianLithuanianLumbeeLuxembourgerMacedonianMalaysianMalteseMarshalleseMenomineeMexicanMexican American IndianMongolianMoroccanNative HawaiianNavajoNepaleseNew ZealanderNicaraguanNigerianNorthern EuropeanNorwegianOkinawanOsageOttawaPaiutePakistaniPalestinianPanamanianParaguayanPennsylvania GermanPeruvianPimaPolishPortuguesePotawatomiPuebloPuerto RicanPuget Sound SalishRomanianRussianSalvadoranSamoanScandinavianScotch-IrishScottishSeminoleSenegaleseSerbianShoshoneSierra LeoneanSiouxSlavicSlovakSloveneSomaliSouth AfricanSouth American IndianSoviet UnionSpaniardSpanishSpanish AmericanSpanish American IndianSri LankanSubsaharan AfricanSudaneseSwedishSwissSyrianTaiwaneseThaiTlingit-HaidaTohono O'OdhamTonganTrinidadian and TobagonianTsimshianTurkishU.S. Virgin IslanderUgandanUkrainianUruguayanUteVenezuelanVietnameseWelshWest IndianYakamaYaquiYugoslavianYumanYup'ikZimbabwean
Immigration
NonimmigrantsImmigrantsAfghanistanAfricaAlbaniaArgentinaArmeniaAsiaAustraliaAustriaBahamasBangladeshBarbadosBelarusBelgiumBelizeBoliviaBosnia and HerzegovinaBrazilBulgariaBurma/MyanmarCabo VerdeCambodiaCameroonCanadaCaribbeanCentral AmericaChileChinaColombiaCongoCosta RicaCroatiaCubaCzechoslovakiaDenmarkDominicaDominican RepublicEastern AfricaEastern AsiaEastern EuropeEcuadorEgyptEl SalvadorEnglandEritreaEthiopiaEuropeFijiFranceGermanyGhanaGreeceGrenadaGuatemalaGuyanaHaitiHondurasHong KongHungaryIndiaIndonesiaIranIraqIrelandIsraelItalyJamaicaJapanJordanKazakhstanKenyaKoreaKuwaitLaosLatin AmericaLatviaLebanonLiberiaLithuaniaMalaysiaMexicoMicronesiaMiddle AfricaMoldovaMoroccoNepalNetherlandsNicaraguaNigeriaNorth AmericaNorth MacedoniaNorthern AfricaNorthern EuropeNorwayOceaniaPakistanPanamaPeruPhilippinesPolandPortugalRomaniaRussiaSaudi ArabiaScotlandSenegalSerbiaSierra LeoneSingaporeSomaliaSouth AfricaSouth AmericaSouth Central AsiaSouth Eastern AsiaSouthern EuropeSpainSri LankaSt. Vincent and the GrenadinesSudanSwedenSwitzerlandSyriaTaiwanThailandTrinidad and TobagoTurkeyUgandaUkraineUruguayUzbekistanVenezuelaVietnamWest IndiesWestern AfricaWestern AsiaWestern EuropeYemenZaireZimbabweAzores
South American
Race
Ancestry
AfghanAfricanAlaska NativeAlaskan AthabascanAlbanianAleutAlsatianAmericanApacheArabArapahoArgentineanArmenianAssyrian/Chaldean/SyriacAustralianAustrianBahamianBangladeshiBarbadianBasqueBelgianBelizeanBermudanBhutaneseBlackfeetBolivianBrazilianBritishBritish West IndianBulgarianBurmeseCajunCambodianCanadianCape VerdeanCarpatho RusynCelticCentral AmericanCentral American IndianCherokeeCheyenneChickasawChileanChineseChippewaChoctawColombianColvilleComancheCosta RicanCreeCreekCroatianCrowCubanCypriotCzechCzechoslovakianDanishDelawareDominicanDutchDutch West IndianEastern EuropeanEcuadorianEgyptianEnglishEstonianEthiopianEuropeanFijianFilipinoFinnishFrenchFrench American IndianFrench CanadianGermanGerman RussianGhanaianGreekGuamanian/ChamorroGuatemalanGuyaneseHaitianHmongHonduranHopiHoumaHungarianIcelanderIndian (Asian)IndonesianInupiatIranianIraqiIrishIroquoisIsraeliItalianJamaicanJapaneseJordanianKenyanKiowaKoreanLaotianLatvianLebaneseLiberianLithuanianLumbeeLuxembourgerMacedonianMalaysianMalteseMarshalleseMenomineeMexicanMexican American IndianMongolianMoroccanNative HawaiianNavajoNepaleseNew ZealanderNicaraguanNigerianNorthern EuropeanNorwegianOkinawanOsageOttawaPaiutePakistaniPalestinianPanamanianParaguayanPennsylvania GermanPeruvianPimaPolishPortuguesePotawatomiPuebloPuerto RicanPuget Sound SalishRomanianRussianSalvadoranSamoanScandinavianScotch-IrishScottishSeminoleSenegaleseSerbianShoshoneSierra LeoneanSiouxSlavicSlovakSloveneSomaliSouth AfricanSouth AmericanSouth American IndianSoviet UnionSpaniardSpanishSpanish AmericanSpanish American IndianSri LankanSubsaharan AfricanSudaneseSwedishSwissSyrianTaiwaneseThaiTlingit-HaidaTohono O'OdhamTonganTrinidadian and TobagonianTsimshianTurkishU.S. Virgin IslanderUgandanUkrainianUruguayanUteVenezuelanVietnameseWelshWest IndianYakamaYaquiYugoslavianYumanYup'ikZimbabwean
Immigration
NonimmigrantsImmigrantsAfghanistanAfricaAlbaniaArgentinaArmeniaAsiaAustraliaAustriaBahamasBangladeshBarbadosBelarusBelgiumBelizeBoliviaBosnia and HerzegovinaBrazilBulgariaBurma/MyanmarCabo VerdeCambodiaCameroonCanadaCaribbeanCentral AmericaChileChinaColombiaCongoCosta RicaCubaCzechoslovakiaDenmarkDominicaDominican RepublicEastern AfricaEastern AsiaEastern EuropeEcuadorEgyptEl SalvadorEnglandEritreaEthiopiaEuropeFijiFranceGermanyGhanaGreeceGrenadaGuatemalaGuyanaHaitiHondurasHong KongHungaryIndiaIndonesiaIranIraqIrelandIsraelItalyJamaicaJapanJordanKazakhstanKenyaKoreaKuwaitLaosLatin AmericaLatviaLebanonLiberiaLithuaniaMalaysiaMexicoMicronesiaMiddle AfricaMoldovaMoroccoNepalNetherlandsNicaraguaNigeriaNorth AmericaNorth MacedoniaNorthern AfricaNorthern EuropeNorwayOceaniaPakistanPanamaPeruPhilippinesPolandPortugalRomaniaRussiaSaudi ArabiaScotlandSenegalSerbiaSierra LeoneSingaporeSomaliaSouth AfricaSouth AmericaSouth Central AsiaSouth Eastern AsiaSouthern EuropeSpainSri LankaSt. Vincent and the GrenadinesSudanSwedenSwitzerlandSyriaTaiwanThailandTrinidad and TobagoTurkeyUgandaUkraineUruguayUzbekistanVenezuelaVietnamWest IndiesWestern AfricaWestern AsiaWestern EuropeYemenZaireZimbabweAzores
High School Diploma
Income
Poverty
Unemployment
Labor Participation
Family Structure
Vehicle Availability
Education Level
Disability

High School Diploma Comparison

Immigrants from Croatia

South Americans

Exceptional
Tragic
90.4%
HIGH SCHOOL DIPLOMA
97.8/ 100
METRIC RATING
104th/ 347
METRIC RANK
87.9%
HIGH SCHOOL DIPLOMA
2.7/ 100
METRIC RATING
239th/ 347
METRIC RANK

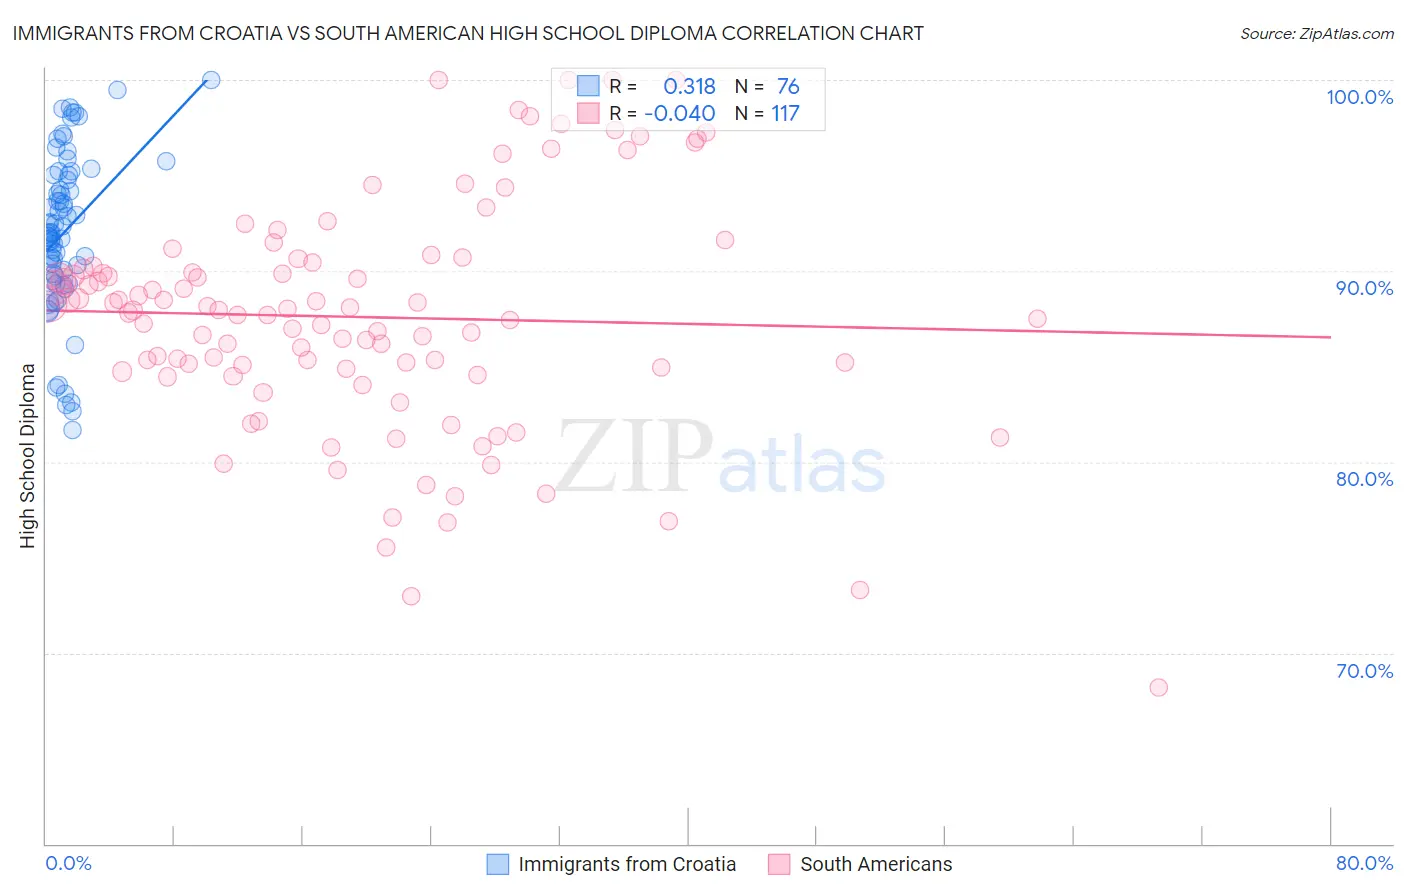
Immigrants from Croatia vs South American High School Diploma Correlation Chart

The statistical analysis conducted on geographies consisting of 132,548,119 people shows a mild positive correlation between the proportion of Immigrants from Croatia and percentage of population with at least high school diploma education in the United States with a correlation coefficient (R) of 0.318 and weighted average of 90.4%. Similarly, the statistical analysis conducted on geographies consisting of 494,065,729 people shows no correlation between the proportion of South Americans and percentage of population with at least high school diploma education in the United States with a correlation coefficient (R) of -0.040 and weighted average of 87.9%, a difference of 2.8%.
Immigrants from Croatia vs South American High School Diploma

High School Diploma Correlation Summary

MeasurementImmigrants from CroatiaSouth American
Minimum81.7%68.2%
Maximum100.0%100.0%
Range18.3%31.8%
Mean92.1%87.6%
Median92.0%87.9%
Interquartile 25% (IQ1)89.8%84.8%
Interquartile 75% (IQ3)95.0%90.3%
Interquartile Range (IQR)5.2%5.5%
Standard Deviation (Sample)4.2%6.1%
Standard Deviation (Population)4.2%6.0%

Similar Demographics by High School Diploma

Demographics Similar to Immigrants from Croatia by High School Diploma

In terms of high school diploma, the demographic groups most similar to Immigrants from Croatia are Immigrants from Romania (90.4%, a difference of 0.010%), Aleut (90.4%, a difference of 0.030%), Immigrants from Norway (90.5%, a difference of 0.040%), Immigrants from North Macedonia (90.5%, a difference of 0.060%), and Lebanese (90.4%, a difference of 0.060%).
DemographicsRating | RankHigh School Diploma
Immigrants | Kuwait
98.3
/100
|
#97
Exceptional
90.5%
Immigrants | Korea
98.3
/100
|
#98
Exceptional
90.5%
Immigrants | Europe
98.2
/100
|
#99
Exceptional
90.5%
Immigrants | North Macedonia
98.1
/100
|
#100
Exceptional
90.5%
Immigrants | Norway
98.0
/100
|
#101
Exceptional
90.5%
Aleuts
98.0
/100
|
#102
Exceptional
90.4%
Immigrants | Romania
97.8
/100
|
#103
Exceptional
90.4%
Immigrants | Croatia
97.8
/100
|
#104
Exceptional
90.4%
Lebanese
97.4
/100
|
#105
Exceptional
90.4%
Syrians
97.0
/100
|
#106
Exceptional
90.3%
Immigrants | Russia
96.9
/100
|
#107
Exceptional
90.3%
Palestinians
96.7
/100
|
#108
Exceptional
90.3%
Immigrants | Zimbabwe
96.7
/100
|
#109
Exceptional
90.3%
Immigrants | Greece
96.6
/100
|
#110
Exceptional
90.3%
Menominee
96.6
/100
|
#111
Exceptional
90.3%

Demographics Similar to South Americans by High School Diploma

In terms of high school diploma, the demographic groups most similar to South Americans are Taiwanese (87.9%, a difference of 0.0%), Sioux (87.9%, a difference of 0.0%), Subsaharan African (87.9%, a difference of 0.010%), Immigrants from Bahamas (88.0%, a difference of 0.030%), and Immigrants from Panama (88.0%, a difference of 0.050%).
DemographicsRating | RankHigh School Diploma
Immigrants | Middle Africa
3.4
/100
|
#232
Tragic
88.0%
Immigrants | Panama
3.1
/100
|
#233
Tragic
88.0%
Immigrants | Thailand
3.1
/100
|
#234
Tragic
88.0%
Immigrants | Bahamas
2.9
/100
|
#235
Tragic
88.0%
Sub-Saharan Africans
2.8
/100
|
#236
Tragic
87.9%
Taiwanese
2.8
/100
|
#237
Tragic
87.9%
Sioux
2.7
/100
|
#238
Tragic
87.9%
South Americans
2.7
/100
|
#239
Tragic
87.9%
Comanche
2.2
/100
|
#240
Tragic
87.9%
Immigrants | Uzbekistan
2.1
/100
|
#241
Tragic
87.8%
Cheyenne
2.1
/100
|
#242
Tragic
87.8%
Immigrants | Philippines
1.9
/100
|
#243
Tragic
87.8%
Choctaw
1.9
/100
|
#244
Tragic
87.8%
Peruvians
1.9
/100
|
#245
Tragic
87.8%
Immigrants | Eritrea
1.7
/100
|
#246
Tragic
87.8%