Immigrants from Croatia vs Paraguayan 5th Grade

COMPARE

Immigrants from Croatia
Race
Ancestry
AfghanAfricanAlaska NativeAlaskan AthabascanAlbanianAleutAlsatianAmericanApacheArabArapahoArgentineanArmenianAssyrian/Chaldean/SyriacAustralianAustrianBahamianBangladeshiBarbadianBasqueBelgianBelizeanBermudanBhutaneseBlackfeetBolivianBrazilianBritishBritish West IndianBulgarianBurmeseCajunCambodianCanadianCape VerdeanCarpatho RusynCelticCentral AmericanCentral American IndianCherokeeCheyenneChickasawChileanChineseChippewaChoctawColombianColvilleComancheCosta RicanCreeCreekCroatianCrowCubanCypriotCzechCzechoslovakianDanishDelawareDominicanDutchDutch West IndianEastern EuropeanEcuadorianEgyptianEnglishEstonianEthiopianEuropeanFijianFilipinoFinnishFrenchFrench American IndianFrench CanadianGermanGerman RussianGhanaianGreekGuamanian/ChamorroGuatemalanGuyaneseHaitianHmongHonduranHopiHoumaHungarianIcelanderIndian (Asian)IndonesianInupiatIranianIraqiIrishIroquoisIsraeliItalianJamaicanJapaneseJordanianKenyanKiowaKoreanLaotianLatvianLebaneseLiberianLithuanianLumbeeLuxembourgerMacedonianMalaysianMalteseMarshalleseMenomineeMexicanMexican American IndianMongolianMoroccanNative HawaiianNavajoNepaleseNew ZealanderNicaraguanNigerianNorthern EuropeanNorwegianOkinawanOsageOttawaPaiutePakistaniPalestinianPanamanianPennsylvania GermanPeruvianPimaPolishPortuguesePotawatomiPuebloPuerto RicanPuget Sound SalishRomanianRussianSalvadoranSamoanScandinavianScotch-IrishScottishSeminoleSenegaleseSerbianShoshoneSierra LeoneanSiouxSlavicSlovakSloveneSomaliSouth AfricanSouth AmericanSouth American IndianSoviet UnionSpaniardSpanishSpanish AmericanSpanish American IndianSri LankanSubsaharan AfricanSudaneseSwedishSwissSyrianTaiwaneseThaiTlingit-HaidaTohono O'OdhamTonganTrinidadian and TobagonianTsimshianTurkishU.S. Virgin IslanderUgandanUkrainianUruguayanUteVenezuelanVietnameseWelshWest IndianYakamaYaquiYugoslavianYumanYup'ikZimbabwean
Immigration
NonimmigrantsImmigrantsAfghanistanAfricaAlbaniaArgentinaArmeniaAsiaAustraliaAustriaBahamasBangladeshBarbadosBelarusBelgiumBelizeBoliviaBosnia and HerzegovinaBrazilBulgariaBurma/MyanmarCabo VerdeCambodiaCameroonCanadaCaribbeanCentral AmericaChileChinaColombiaCongoCosta RicaCroatiaCubaCzechoslovakiaDenmarkDominicaDominican RepublicEastern AfricaEastern AsiaEastern EuropeEcuadorEgyptEl SalvadorEnglandEritreaEthiopiaEuropeFijiFranceGermanyGhanaGreeceGrenadaGuatemalaGuyanaHaitiHondurasHong KongHungaryIndiaIndonesiaIranIraqIrelandIsraelItalyJamaicaJapanJordanKazakhstanKenyaKoreaKuwaitLaosLatin AmericaLatviaLebanonLiberiaLithuaniaMalaysiaMexicoMicronesiaMiddle AfricaMoldovaMoroccoNepalNetherlandsNicaraguaNigeriaNorth AmericaNorth MacedoniaNorthern AfricaNorthern EuropeNorwayOceaniaPakistanPanamaPeruPhilippinesPolandPortugalRomaniaRussiaSaudi ArabiaScotlandSenegalSerbiaSierra LeoneSingaporeSomaliaSouth AfricaSouth AmericaSouth Central AsiaSouth Eastern AsiaSouthern EuropeSpainSri LankaSt. Vincent and the GrenadinesSudanSwedenSwitzerlandSyriaTaiwanThailandTrinidad and TobagoTurkeyUgandaUkraineUruguayUzbekistanVenezuelaVietnamWest IndiesWestern AfricaWestern AsiaWestern EuropeYemenZaireZimbabweAzores
Paraguayan
Race
Ancestry
AfghanAfricanAlaska NativeAlaskan AthabascanAlbanianAleutAlsatianAmericanApacheArabArapahoArgentineanArmenianAssyrian/Chaldean/SyriacAustralianAustrianBahamianBangladeshiBarbadianBasqueBelgianBelizeanBermudanBhutaneseBlackfeetBolivianBrazilianBritishBritish West IndianBulgarianBurmeseCajunCambodianCanadianCape VerdeanCarpatho RusynCelticCentral AmericanCentral American IndianCherokeeCheyenneChickasawChileanChineseChippewaChoctawColombianColvilleComancheCosta RicanCreeCreekCroatianCrowCubanCypriotCzechCzechoslovakianDanishDelawareDominicanDutchDutch West IndianEastern EuropeanEcuadorianEgyptianEnglishEstonianEthiopianEuropeanFijianFilipinoFinnishFrenchFrench American IndianFrench CanadianGermanGerman RussianGhanaianGreekGuamanian/ChamorroGuatemalanGuyaneseHaitianHmongHonduranHopiHoumaHungarianIcelanderIndian (Asian)IndonesianInupiatIranianIraqiIrishIroquoisIsraeliItalianJamaicanJapaneseJordanianKenyanKiowaKoreanLaotianLatvianLebaneseLiberianLithuanianLumbeeLuxembourgerMacedonianMalaysianMalteseMarshalleseMenomineeMexicanMexican American IndianMongolianMoroccanNative HawaiianNavajoNepaleseNew ZealanderNicaraguanNigerianNorthern EuropeanNorwegianOkinawanOsageOttawaPaiutePakistaniPalestinianPanamanianParaguayanPennsylvania GermanPeruvianPimaPolishPortuguesePotawatomiPuebloPuerto RicanPuget Sound SalishRomanianRussianSalvadoranSamoanScandinavianScotch-IrishScottishSeminoleSenegaleseSerbianShoshoneSierra LeoneanSiouxSlavicSlovakSloveneSomaliSouth AfricanSouth AmericanSouth American IndianSoviet UnionSpaniardSpanishSpanish AmericanSpanish American IndianSri LankanSubsaharan AfricanSudaneseSwedishSwissSyrianTaiwaneseThaiTlingit-HaidaTohono O'OdhamTonganTrinidadian and TobagonianTsimshianTurkishU.S. Virgin IslanderUgandanUkrainianUruguayanUteVenezuelanVietnameseWelshWest IndianYakamaYaquiYugoslavianYumanYup'ikZimbabwean
Immigration
NonimmigrantsImmigrantsAfghanistanAfricaAlbaniaArgentinaArmeniaAsiaAustraliaAustriaBahamasBangladeshBarbadosBelarusBelgiumBelizeBoliviaBosnia and HerzegovinaBrazilBulgariaBurma/MyanmarCabo VerdeCambodiaCameroonCanadaCaribbeanCentral AmericaChileChinaColombiaCongoCosta RicaCubaCzechoslovakiaDenmarkDominicaDominican RepublicEastern AfricaEastern AsiaEastern EuropeEcuadorEgyptEl SalvadorEnglandEritreaEthiopiaEuropeFijiFranceGermanyGhanaGreeceGrenadaGuatemalaGuyanaHaitiHondurasHong KongHungaryIndiaIndonesiaIranIraqIrelandIsraelItalyJamaicaJapanJordanKazakhstanKenyaKoreaKuwaitLaosLatin AmericaLatviaLebanonLiberiaLithuaniaMalaysiaMexicoMicronesiaMiddle AfricaMoldovaMoroccoNepalNetherlandsNicaraguaNigeriaNorth AmericaNorth MacedoniaNorthern AfricaNorthern EuropeNorwayOceaniaPakistanPanamaPeruPhilippinesPolandPortugalRomaniaRussiaSaudi ArabiaScotlandSenegalSerbiaSierra LeoneSingaporeSomaliaSouth AfricaSouth AmericaSouth Central AsiaSouth Eastern AsiaSouthern EuropeSpainSri LankaSt. Vincent and the GrenadinesSudanSwedenSwitzerlandSyriaTaiwanThailandTrinidad and TobagoTurkeyUgandaUkraineUruguayUzbekistanVenezuelaVietnamWest IndiesWestern AfricaWestern AsiaWestern EuropeYemenZaireZimbabweAzores
5th Grade
Income
Poverty
Unemployment
Labor Participation
Family Structure
Vehicle Availability
Education Level
Disability

5th Grade Comparison

Immigrants from Croatia

Paraguayans

Exceptional
Fair
97.6%
5TH GRADE
95.5/ 100
METRIC RATING
116th/ 347
METRIC RANK
97.3%
5TH GRADE
33.7/ 100
METRIC RATING
188th/ 347
METRIC RANK

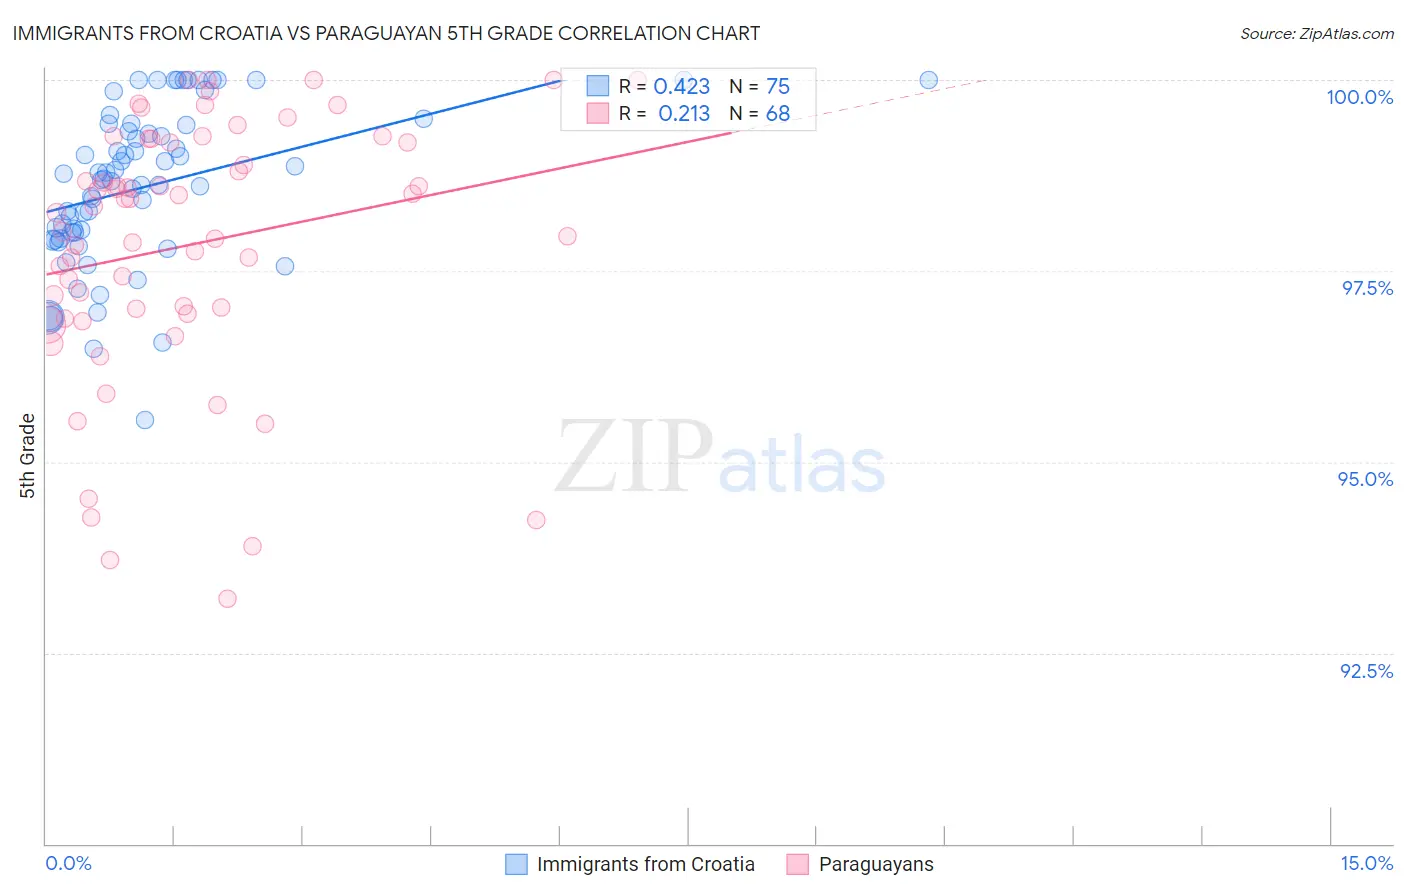
Immigrants from Croatia vs Paraguayan 5th Grade Correlation Chart

The statistical analysis conducted on geographies consisting of 132,508,207 people shows a moderate positive correlation between the proportion of Immigrants from Croatia and percentage of population with at least 5th grade education in the United States with a correlation coefficient (R) of 0.423 and weighted average of 97.6%. Similarly, the statistical analysis conducted on geographies consisting of 95,115,093 people shows a weak positive correlation between the proportion of Paraguayans and percentage of population with at least 5th grade education in the United States with a correlation coefficient (R) of 0.213 and weighted average of 97.3%, a difference of 0.39%.
Immigrants from Croatia vs Paraguayan 5th Grade

5th Grade Correlation Summary

MeasurementImmigrants from CroatiaParaguayan
Minimum95.5%93.2%
Maximum100.0%100.0%
Range4.5%6.8%
Mean98.6%97.8%
Median98.7%98.3%
Interquartile 25% (IQ1)97.9%97.0%
Interquartile 75% (IQ3)99.4%99.2%
Interquartile Range (IQR)1.5%2.2%
Standard Deviation (Sample)1.0%1.7%
Standard Deviation (Population)1.0%1.7%

Similar Demographics by 5th Grade

Demographics Similar to Immigrants from Croatia by 5th Grade

In terms of 5th grade, the demographic groups most similar to Immigrants from Croatia are Lebanese (97.6%, a difference of 0.0%), Okinawan (97.6%, a difference of 0.0%), Immigrants from Saudi Arabia (97.6%, a difference of 0.0%), Immigrants from Switzerland (97.7%, a difference of 0.010%), and Iroquois (97.7%, a difference of 0.010%).
DemographicsRating | Rank5th Grade
Immigrants | Latvia
97.1
/100
|
#109
Exceptional
97.7%
Thais
96.9
/100
|
#110
Exceptional
97.7%
Menominee
96.3
/100
|
#111
Exceptional
97.7%
Immigrants | Switzerland
96.0
/100
|
#112
Exceptional
97.7%
Iroquois
95.9
/100
|
#113
Exceptional
97.7%
Lebanese
95.7
/100
|
#114
Exceptional
97.6%
Okinawans
95.7
/100
|
#115
Exceptional
97.6%
Immigrants | Croatia
95.5
/100
|
#116
Exceptional
97.6%
Immigrants | Saudi Arabia
95.4
/100
|
#117
Exceptional
97.6%
Basques
95.2
/100
|
#118
Exceptional
97.6%
Syrians
95.1
/100
|
#119
Exceptional
97.6%
Immigrants | Zimbabwe
94.9
/100
|
#120
Exceptional
97.6%
Immigrants | France
94.8
/100
|
#121
Exceptional
97.6%
Immigrants | Japan
94.7
/100
|
#122
Exceptional
97.6%
Immigrants | Norway
94.6
/100
|
#123
Exceptional
97.6%

Demographics Similar to Paraguayans by 5th Grade

In terms of 5th grade, the demographic groups most similar to Paraguayans are Spanish American (97.3%, a difference of 0.0%), Immigrants from Egypt (97.3%, a difference of 0.0%), Dutch West Indian (97.3%, a difference of 0.010%), Immigrants from Argentina (97.3%, a difference of 0.010%), and Black/African American (97.3%, a difference of 0.010%).
DemographicsRating | Rank5th Grade
Argentineans
39.5
/100
|
#181
Fair
97.3%
Mongolians
39.4
/100
|
#182
Fair
97.3%
Immigrants | Ukraine
38.6
/100
|
#183
Fair
97.3%
Immigrants | Venezuela
38.4
/100
|
#184
Fair
97.3%
Dutch West Indians
36.2
/100
|
#185
Fair
97.3%
Immigrants | Argentina
36.1
/100
|
#186
Fair
97.3%
Spanish Americans
34.7
/100
|
#187
Fair
97.3%
Paraguayans
33.7
/100
|
#188
Fair
97.3%
Immigrants | Egypt
32.9
/100
|
#189
Fair
97.3%
Blacks/African Americans
31.8
/100
|
#190
Fair
97.3%
Immigrants | Brazil
31.5
/100
|
#191
Fair
97.3%
Panamanians
31.3
/100
|
#192
Fair
97.3%
Navajo
29.0
/100
|
#193
Fair
97.2%
Immigrants | Albania
28.5
/100
|
#194
Fair
97.2%
Guamanians/Chamorros
26.8
/100
|
#195
Fair
97.2%