Immigrants from Croatia vs Immigrants from Turkey College, Under 1 year

COMPARE

Immigrants from Croatia
Race
Ancestry
AfghanAfricanAlaska NativeAlaskan AthabascanAlbanianAleutAlsatianAmericanApacheArabArapahoArgentineanArmenianAssyrian/Chaldean/SyriacAustralianAustrianBahamianBangladeshiBarbadianBasqueBelgianBelizeanBermudanBhutaneseBlackfeetBolivianBrazilianBritishBritish West IndianBulgarianBurmeseCajunCambodianCanadianCape VerdeanCarpatho RusynCelticCentral AmericanCentral American IndianCherokeeCheyenneChickasawChileanChineseChippewaChoctawColombianColvilleComancheCosta RicanCreeCreekCroatianCrowCubanCypriotCzechCzechoslovakianDanishDelawareDominicanDutchDutch West IndianEastern EuropeanEcuadorianEgyptianEnglishEstonianEthiopianEuropeanFijianFilipinoFinnishFrenchFrench American IndianFrench CanadianGermanGerman RussianGhanaianGreekGuamanian/ChamorroGuatemalanGuyaneseHaitianHmongHonduranHopiHoumaHungarianIcelanderIndian (Asian)IndonesianInupiatIranianIraqiIrishIroquoisIsraeliItalianJamaicanJapaneseJordanianKenyanKiowaKoreanLaotianLatvianLebaneseLiberianLithuanianLumbeeLuxembourgerMacedonianMalaysianMalteseMarshalleseMenomineeMexicanMexican American IndianMongolianMoroccanNative HawaiianNavajoNepaleseNew ZealanderNicaraguanNigerianNorthern EuropeanNorwegianOkinawanOsageOttawaPaiutePakistaniPalestinianPanamanianParaguayanPennsylvania GermanPeruvianPimaPolishPortuguesePotawatomiPuebloPuerto RicanPuget Sound SalishRomanianRussianSalvadoranSamoanScandinavianScotch-IrishScottishSeminoleSenegaleseSerbianShoshoneSierra LeoneanSiouxSlavicSlovakSloveneSomaliSouth AfricanSouth AmericanSouth American IndianSoviet UnionSpaniardSpanishSpanish AmericanSpanish American IndianSri LankanSubsaharan AfricanSudaneseSwedishSwissSyrianTaiwaneseThaiTlingit-HaidaTohono O'OdhamTonganTrinidadian and TobagonianTsimshianTurkishU.S. Virgin IslanderUgandanUkrainianUruguayanUteVenezuelanVietnameseWelshWest IndianYakamaYaquiYugoslavianYumanYup'ikZimbabwean
Immigration
NonimmigrantsImmigrantsAfghanistanAfricaAlbaniaArgentinaArmeniaAsiaAustraliaAustriaBahamasBangladeshBarbadosBelarusBelgiumBelizeBoliviaBosnia and HerzegovinaBrazilBulgariaBurma/MyanmarCabo VerdeCambodiaCameroonCanadaCaribbeanCentral AmericaChileChinaColombiaCongoCosta RicaCroatiaCubaCzechoslovakiaDenmarkDominicaDominican RepublicEastern AfricaEastern AsiaEastern EuropeEcuadorEgyptEl SalvadorEnglandEritreaEthiopiaEuropeFijiFranceGermanyGhanaGreeceGrenadaGuatemalaGuyanaHaitiHondurasHong KongHungaryIndiaIndonesiaIranIraqIrelandIsraelItalyJamaicaJapanJordanKazakhstanKenyaKoreaKuwaitLaosLatin AmericaLatviaLebanonLiberiaLithuaniaMalaysiaMexicoMicronesiaMiddle AfricaMoldovaMoroccoNepalNetherlandsNicaraguaNigeriaNorth AmericaNorth MacedoniaNorthern AfricaNorthern EuropeNorwayOceaniaPakistanPanamaPeruPhilippinesPolandPortugalRomaniaRussiaSaudi ArabiaScotlandSenegalSerbiaSierra LeoneSingaporeSomaliaSouth AfricaSouth AmericaSouth Central AsiaSouth Eastern AsiaSouthern EuropeSpainSri LankaSt. Vincent and the GrenadinesSudanSwedenSwitzerlandSyriaTaiwanThailandTrinidad and TobagoUgandaUkraineUruguayUzbekistanVenezuelaVietnamWest IndiesWestern AfricaWestern AsiaWestern EuropeYemenZaireZimbabweAzores
Immigrants from Turkey
Race
Ancestry
AfghanAfricanAlaska NativeAlaskan AthabascanAlbanianAleutAlsatianAmericanApacheArabArapahoArgentineanArmenianAssyrian/Chaldean/SyriacAustralianAustrianBahamianBangladeshiBarbadianBasqueBelgianBelizeanBermudanBhutaneseBlackfeetBolivianBrazilianBritishBritish West IndianBulgarianBurmeseCajunCambodianCanadianCape VerdeanCarpatho RusynCelticCentral AmericanCentral American IndianCherokeeCheyenneChickasawChileanChineseChippewaChoctawColombianColvilleComancheCosta RicanCreeCreekCroatianCrowCubanCypriotCzechCzechoslovakianDanishDelawareDominicanDutchDutch West IndianEastern EuropeanEcuadorianEgyptianEnglishEstonianEthiopianEuropeanFijianFilipinoFinnishFrenchFrench American IndianFrench CanadianGermanGerman RussianGhanaianGreekGuamanian/ChamorroGuatemalanGuyaneseHaitianHmongHonduranHopiHoumaHungarianIcelanderIndian (Asian)IndonesianInupiatIranianIraqiIrishIroquoisIsraeliItalianJamaicanJapaneseJordanianKenyanKiowaKoreanLaotianLatvianLebaneseLiberianLithuanianLumbeeLuxembourgerMacedonianMalaysianMalteseMarshalleseMenomineeMexicanMexican American IndianMongolianMoroccanNative HawaiianNavajoNepaleseNew ZealanderNicaraguanNigerianNorthern EuropeanNorwegianOkinawanOsageOttawaPaiutePakistaniPalestinianPanamanianParaguayanPennsylvania GermanPeruvianPimaPolishPortuguesePotawatomiPuebloPuerto RicanPuget Sound SalishRomanianRussianSalvadoranSamoanScandinavianScotch-IrishScottishSeminoleSenegaleseSerbianShoshoneSierra LeoneanSiouxSlavicSlovakSloveneSomaliSouth AfricanSouth AmericanSouth American IndianSoviet UnionSpaniardSpanishSpanish AmericanSpanish American IndianSri LankanSubsaharan AfricanSudaneseSwedishSwissSyrianTaiwaneseThaiTlingit-HaidaTohono O'OdhamTonganTrinidadian and TobagonianTsimshianTurkishU.S. Virgin IslanderUgandanUkrainianUruguayanUteVenezuelanVietnameseWelshWest IndianYakamaYaquiYugoslavianYumanYup'ikZimbabwean
Immigration
NonimmigrantsImmigrantsAfghanistanAfricaAlbaniaArgentinaArmeniaAsiaAustraliaAustriaBahamasBangladeshBarbadosBelarusBelgiumBelizeBoliviaBosnia and HerzegovinaBrazilBulgariaBurma/MyanmarCabo VerdeCambodiaCameroonCanadaCaribbeanCentral AmericaChileChinaColombiaCongoCosta RicaCubaCzechoslovakiaDenmarkDominicaDominican RepublicEastern AfricaEastern AsiaEastern EuropeEcuadorEgyptEl SalvadorEnglandEritreaEthiopiaEuropeFijiFranceGermanyGhanaGreeceGrenadaGuatemalaGuyanaHaitiHondurasHong KongHungaryIndiaIndonesiaIranIraqIrelandIsraelItalyJamaicaJapanJordanKazakhstanKenyaKoreaKuwaitLaosLatin AmericaLatviaLebanonLiberiaLithuaniaMalaysiaMexicoMicronesiaMiddle AfricaMoldovaMoroccoNepalNetherlandsNicaraguaNigeriaNorth AmericaNorth MacedoniaNorthern AfricaNorthern EuropeNorwayOceaniaPakistanPanamaPeruPhilippinesPolandPortugalRomaniaRussiaSaudi ArabiaScotlandSenegalSerbiaSierra LeoneSingaporeSomaliaSouth AfricaSouth AmericaSouth Central AsiaSouth Eastern AsiaSouthern EuropeSpainSri LankaSt. Vincent and the GrenadinesSudanSwedenSwitzerlandSyriaTaiwanThailandTrinidad and TobagoTurkeyUgandaUkraineUruguayUzbekistanVenezuelaVietnamWest IndiesWestern AfricaWestern AsiaWestern EuropeYemenZaireZimbabweAzores
College, Under 1 year
Income
Poverty
Unemployment
Labor Participation
Family Structure
Vehicle Availability
Education Level
Disability

College, Under 1 year Comparison

Immigrants from Croatia

Immigrants from Turkey

Exceptional
Exceptional
67.8%
COLLEGE, UNDER 1 YEAR
96.6/ 100
METRIC RATING
106th/ 347
METRIC RANK
70.3%
COLLEGE, UNDER 1 YEAR
99.9/ 100
METRIC RATING
40th/ 347
METRIC RANK

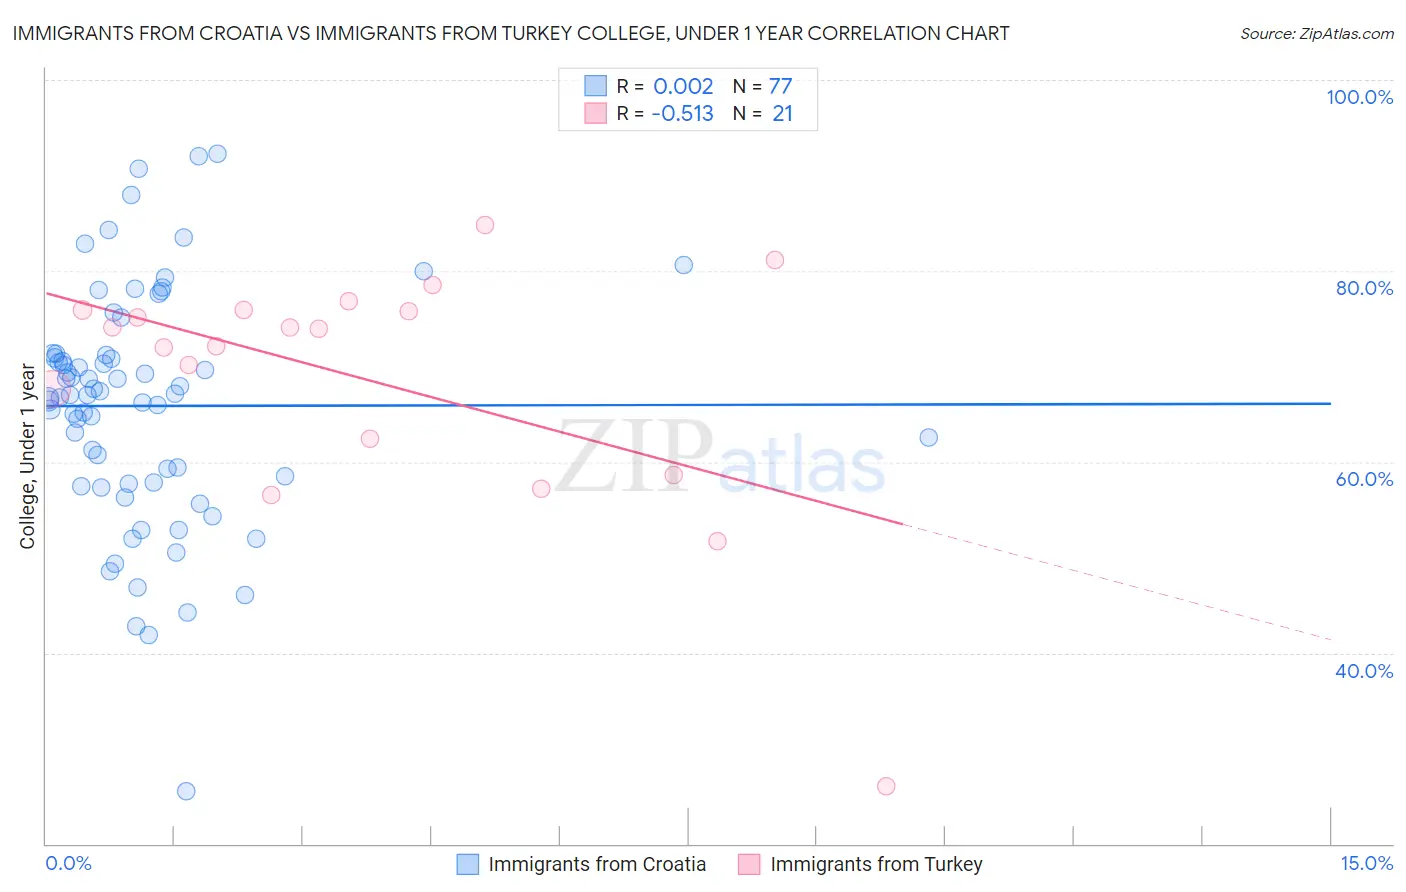
Immigrants from Croatia vs Immigrants from Turkey College, Under 1 year Correlation Chart

The statistical analysis conducted on geographies consisting of 132,577,989 people shows no correlation between the proportion of Immigrants from Croatia and percentage of population with at least college, under 1 year education in the United States with a correlation coefficient (R) of 0.002 and weighted average of 67.8%. Similarly, the statistical analysis conducted on geographies consisting of 223,057,840 people shows a substantial negative correlation between the proportion of Immigrants from Turkey and percentage of population with at least college, under 1 year education in the United States with a correlation coefficient (R) of -0.513 and weighted average of 70.3%, a difference of 3.7%.
Immigrants from Croatia vs Immigrants from Turkey College, Under 1 year

College, Under 1 year Correlation Summary

MeasurementImmigrants from CroatiaImmigrants from Turkey
Minimum25.4%26.0%
Maximum92.2%84.8%
Range66.8%58.8%
Mean65.9%68.6%
Median67.1%74.0%
Interquartile 25% (IQ1)57.8%60.6%
Interquartile 75% (IQ3)71.3%75.9%
Interquartile Range (IQR)13.5%15.3%
Standard Deviation (Sample)12.3%13.1%
Standard Deviation (Population)12.3%12.8%

Similar Demographics by College, Under 1 year

Demographics Similar to Immigrants from Croatia by College, Under 1 year

In terms of college, under 1 year, the demographic groups most similar to Immigrants from Croatia are Immigrants from Western Asia (67.8%, a difference of 0.010%), Afghan (67.8%, a difference of 0.010%), Austrian (67.8%, a difference of 0.060%), Palestinian (67.9%, a difference of 0.090%), and Carpatho Rusyn (67.9%, a difference of 0.090%).
DemographicsRating | RankCollege, Under 1 year
Immigrants | Bolivia
97.0
/100
|
#99
Exceptional
67.9%
Immigrants | Argentina
97.0
/100
|
#100
Exceptional
67.9%
Immigrants | Eastern Europe
96.9
/100
|
#101
Exceptional
67.9%
Palestinians
96.9
/100
|
#102
Exceptional
67.9%
Carpatho Rusyns
96.8
/100
|
#103
Exceptional
67.9%
Immigrants | Western Asia
96.6
/100
|
#104
Exceptional
67.8%
Afghans
96.6
/100
|
#105
Exceptional
67.8%
Immigrants | Croatia
96.6
/100
|
#106
Exceptional
67.8%
Austrians
96.4
/100
|
#107
Exceptional
67.8%
Immigrants | Egypt
96.0
/100
|
#108
Exceptional
67.7%
Scandinavians
95.8
/100
|
#109
Exceptional
67.7%
Assyrians/Chaldeans/Syriacs
95.8
/100
|
#110
Exceptional
67.7%
Ukrainians
95.8
/100
|
#111
Exceptional
67.7%
Macedonians
95.7
/100
|
#112
Exceptional
67.6%
Syrians
95.6
/100
|
#113
Exceptional
67.6%

Demographics Similar to Immigrants from Turkey by College, Under 1 year

In terms of college, under 1 year, the demographic groups most similar to Immigrants from Turkey are Bhutanese (70.3%, a difference of 0.010%), Australian (70.4%, a difference of 0.030%), Immigrants from Kuwait (70.3%, a difference of 0.040%), Immigrants from Lithuania (70.3%, a difference of 0.090%), and Immigrants from Saudi Arabia (70.4%, a difference of 0.10%).
DemographicsRating | RankCollege, Under 1 year
Immigrants | South Africa
99.9
/100
|
#33
Exceptional
70.6%
Estonians
99.9
/100
|
#34
Exceptional
70.6%
Russians
99.9
/100
|
#35
Exceptional
70.5%
Immigrants | Sri Lanka
99.9
/100
|
#36
Exceptional
70.5%
Immigrants | Saudi Arabia
99.9
/100
|
#37
Exceptional
70.4%
Australians
99.9
/100
|
#38
Exceptional
70.4%
Bhutanese
99.9
/100
|
#39
Exceptional
70.3%
Immigrants | Turkey
99.9
/100
|
#40
Exceptional
70.3%
Immigrants | Kuwait
99.9
/100
|
#41
Exceptional
70.3%
Immigrants | Lithuania
99.9
/100
|
#42
Exceptional
70.3%
Israelis
99.9
/100
|
#43
Exceptional
70.2%
New Zealanders
99.9
/100
|
#44
Exceptional
70.2%
Immigrants | Norway
99.9
/100
|
#45
Exceptional
70.2%
Immigrants | Latvia
99.9
/100
|
#46
Exceptional
70.1%
Immigrants | Bulgaria
99.8
/100
|
#47
Exceptional
70.0%