Immigrants from Croatia vs Immigrants from Trinidad and Tobago 8th Grade
COMPARE
Immigrants from Croatia
Immigrants from Trinidad and Tobago
8th Grade
8th Grade Comparison
Immigrants from Croatia
Immigrants from Trinidad and Tobago
96.2%
8TH GRADE
96.0/ 100
METRIC RATING
117th/ 347
METRIC RANK
94.6%
8TH GRADE
0.1/ 100
METRIC RATING
279th/ 347
METRIC RANK
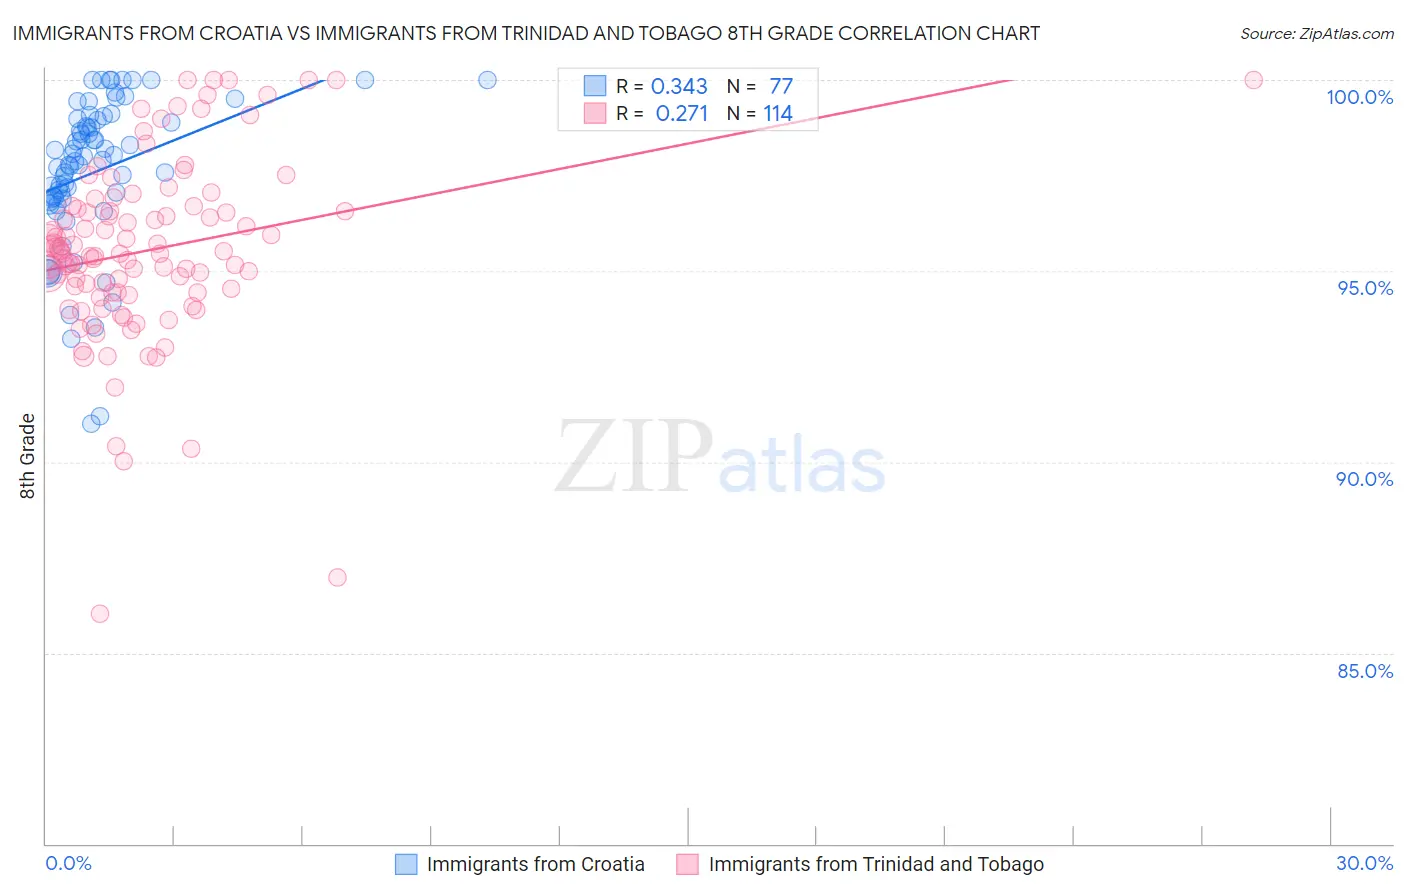
Immigrants from Croatia vs Immigrants from Trinidad and Tobago 8th Grade Correlation Chart
The statistical analysis conducted on geographies consisting of 132,548,291 people shows a mild positive correlation between the proportion of Immigrants from Croatia and percentage of population with at least 8th grade education in the United States with a correlation coefficient (R) of 0.343 and weighted average of 96.2%. Similarly, the statistical analysis conducted on geographies consisting of 223,526,834 people shows a weak positive correlation between the proportion of Immigrants from Trinidad and Tobago and percentage of population with at least 8th grade education in the United States with a correlation coefficient (R) of 0.271 and weighted average of 94.6%, a difference of 1.7%.
8th Grade Correlation Summary
| Measurement | Immigrants from Croatia | Immigrants from Trinidad and Tobago |
| Minimum | 91.0% | 86.0% |
| Maximum | 100.0% | 100.0% |
| Range | 9.0% | 14.0% |
| Mean | 97.6% | 95.5% |
| Median | 97.9% | 95.5% |
| Interquartile 25% (IQ1) | 96.9% | 94.4% |
| Interquartile 75% (IQ3) | 99.0% | 96.6% |
| Interquartile Range (IQR) | 2.1% | 2.2% |
| Standard Deviation (Sample) | 2.0% | 2.4% |
| Standard Deviation (Population) | 1.9% | 2.4% |
Similar Demographics by 8th Grade
Demographics Similar to Immigrants from Croatia by 8th Grade
In terms of 8th grade, the demographic groups most similar to Immigrants from Croatia are Nonimmigrants (96.2%, a difference of 0.0%), Immigrants from Norway (96.2%, a difference of 0.010%), Immigrants from Japan (96.2%, a difference of 0.020%), Immigrants from Moldova (96.2%, a difference of 0.020%), and Syrian (96.3%, a difference of 0.030%).
| Demographics | Rating | Rank | 8th Grade |
| Cajuns | 97.1 /100 | #110 | Exceptional 96.3% |
| Shoshone | 96.8 /100 | #111 | Exceptional 96.3% |
| Syrians | 96.7 /100 | #112 | Exceptional 96.3% |
| Immigrants | Zimbabwe | 96.7 /100 | #113 | Exceptional 96.3% |
| Immigrants | Japan | 96.5 /100 | #114 | Exceptional 96.2% |
| Immigrants | Moldova | 96.5 /100 | #115 | Exceptional 96.2% |
| Immigrants | Nonimmigrants | 96.0 /100 | #116 | Exceptional 96.2% |
| Immigrants | Croatia | 96.0 /100 | #117 | Exceptional 96.2% |
| Immigrants | Norway | 95.7 /100 | #118 | Exceptional 96.2% |
| Immigrants | Switzerland | 95.3 /100 | #119 | Exceptional 96.2% |
| Immigrants | France | 95.3 /100 | #120 | Exceptional 96.2% |
| Immigrants | Bulgaria | 95.3 /100 | #121 | Exceptional 96.2% |
| Immigrants | Europe | 95.3 /100 | #122 | Exceptional 96.2% |
| Filipinos | 94.6 /100 | #123 | Exceptional 96.2% |
| Palestinians | 94.6 /100 | #124 | Exceptional 96.2% |
Demographics Similar to Immigrants from Trinidad and Tobago by 8th Grade
In terms of 8th grade, the demographic groups most similar to Immigrants from Trinidad and Tobago are Barbadian (94.6%, a difference of 0.0%), Armenian (94.7%, a difference of 0.010%), Immigrants from Bolivia (94.6%, a difference of 0.010%), Taiwanese (94.7%, a difference of 0.040%), and Immigrants from Eritrea (94.6%, a difference of 0.050%).
| Demographics | Rating | Rank | 8th Grade |
| Immigrants | South America | 0.2 /100 | #272 | Tragic 94.8% |
| Immigrants | Western Africa | 0.2 /100 | #273 | Tragic 94.8% |
| Trinidadians and Tobagonians | 0.2 /100 | #274 | Tragic 94.7% |
| Immigrants | Colombia | 0.2 /100 | #275 | Tragic 94.7% |
| Peruvians | 0.1 /100 | #276 | Tragic 94.7% |
| Taiwanese | 0.1 /100 | #277 | Tragic 94.7% |
| Armenians | 0.1 /100 | #278 | Tragic 94.7% |
| Immigrants | Trinidad and Tobago | 0.1 /100 | #279 | Tragic 94.6% |
| Barbadians | 0.1 /100 | #280 | Tragic 94.6% |
| Immigrants | Bolivia | 0.1 /100 | #281 | Tragic 94.6% |
| Immigrants | Eritrea | 0.1 /100 | #282 | Tragic 94.6% |
| Immigrants | St. Vincent and the Grenadines | 0.1 /100 | #283 | Tragic 94.6% |
| Immigrants | Philippines | 0.1 /100 | #284 | Tragic 94.6% |
| Immigrants | Barbados | 0.0 /100 | #285 | Tragic 94.5% |
| Immigrants | Peru | 0.0 /100 | #286 | Tragic 94.5% |