Immigrants from Croatia vs Immigrants from Sudan Nursery School

COMPARE

Immigrants from Croatia
Race
Ancestry
AfghanAfricanAlaska NativeAlaskan AthabascanAlbanianAleutAlsatianAmericanApacheArabArapahoArgentineanArmenianAssyrian/Chaldean/SyriacAustralianAustrianBahamianBangladeshiBarbadianBasqueBelgianBelizeanBermudanBhutaneseBlackfeetBolivianBrazilianBritishBritish West IndianBulgarianBurmeseCajunCambodianCanadianCape VerdeanCarpatho RusynCelticCentral AmericanCentral American IndianCherokeeCheyenneChickasawChileanChineseChippewaChoctawColombianColvilleComancheCosta RicanCreeCreekCroatianCrowCubanCypriotCzechCzechoslovakianDanishDelawareDominicanDutchDutch West IndianEastern EuropeanEcuadorianEgyptianEnglishEstonianEthiopianEuropeanFijianFilipinoFinnishFrenchFrench American IndianFrench CanadianGermanGerman RussianGhanaianGreekGuamanian/ChamorroGuatemalanGuyaneseHaitianHmongHonduranHopiHoumaHungarianIcelanderIndian (Asian)IndonesianInupiatIranianIraqiIrishIroquoisIsraeliItalianJamaicanJapaneseJordanianKenyanKiowaKoreanLaotianLatvianLebaneseLiberianLithuanianLumbeeLuxembourgerMacedonianMalaysianMalteseMarshalleseMenomineeMexicanMexican American IndianMongolianMoroccanNative HawaiianNavajoNepaleseNew ZealanderNicaraguanNigerianNorthern EuropeanNorwegianOkinawanOsageOttawaPaiutePakistaniPalestinianPanamanianParaguayanPennsylvania GermanPeruvianPimaPolishPortuguesePotawatomiPuebloPuerto RicanPuget Sound SalishRomanianRussianSalvadoranSamoanScandinavianScotch-IrishScottishSeminoleSenegaleseSerbianShoshoneSierra LeoneanSiouxSlavicSlovakSloveneSomaliSouth AfricanSouth AmericanSouth American IndianSoviet UnionSpaniardSpanishSpanish AmericanSpanish American IndianSri LankanSubsaharan AfricanSudaneseSwedishSwissSyrianTaiwaneseThaiTlingit-HaidaTohono O'OdhamTonganTrinidadian and TobagonianTsimshianTurkishU.S. Virgin IslanderUgandanUkrainianUruguayanUteVenezuelanVietnameseWelshWest IndianYakamaYaquiYugoslavianYumanYup'ikZimbabwean
Immigration
NonimmigrantsImmigrantsAfghanistanAfricaAlbaniaArgentinaArmeniaAsiaAustraliaAustriaBahamasBangladeshBarbadosBelarusBelgiumBelizeBoliviaBosnia and HerzegovinaBrazilBulgariaBurma/MyanmarCabo VerdeCambodiaCameroonCanadaCaribbeanCentral AmericaChileChinaColombiaCongoCosta RicaCroatiaCubaCzechoslovakiaDenmarkDominicaDominican RepublicEastern AfricaEastern AsiaEastern EuropeEcuadorEgyptEl SalvadorEnglandEritreaEthiopiaEuropeFijiFranceGermanyGhanaGreeceGrenadaGuatemalaGuyanaHaitiHondurasHong KongHungaryIndiaIndonesiaIranIraqIrelandIsraelItalyJamaicaJapanJordanKazakhstanKenyaKoreaKuwaitLaosLatin AmericaLatviaLebanonLiberiaLithuaniaMalaysiaMexicoMicronesiaMiddle AfricaMoldovaMoroccoNepalNetherlandsNicaraguaNigeriaNorth AmericaNorth MacedoniaNorthern AfricaNorthern EuropeNorwayOceaniaPakistanPanamaPeruPhilippinesPolandPortugalRomaniaRussiaSaudi ArabiaScotlandSenegalSerbiaSierra LeoneSingaporeSomaliaSouth AfricaSouth AmericaSouth Central AsiaSouth Eastern AsiaSouthern EuropeSpainSri LankaSt. Vincent and the GrenadinesSwedenSwitzerlandSyriaTaiwanThailandTrinidad and TobagoTurkeyUgandaUkraineUruguayUzbekistanVenezuelaVietnamWest IndiesWestern AfricaWestern AsiaWestern EuropeYemenZaireZimbabweAzores
Immigrants from Sudan
Race
Ancestry
AfghanAfricanAlaska NativeAlaskan AthabascanAlbanianAleutAlsatianAmericanApacheArabArapahoArgentineanArmenianAssyrian/Chaldean/SyriacAustralianAustrianBahamianBangladeshiBarbadianBasqueBelgianBelizeanBermudanBhutaneseBlackfeetBolivianBrazilianBritishBritish West IndianBulgarianBurmeseCajunCambodianCanadianCape VerdeanCarpatho RusynCelticCentral AmericanCentral American IndianCherokeeCheyenneChickasawChileanChineseChippewaChoctawColombianColvilleComancheCosta RicanCreeCreekCroatianCrowCubanCypriotCzechCzechoslovakianDanishDelawareDominicanDutchDutch West IndianEastern EuropeanEcuadorianEgyptianEnglishEstonianEthiopianEuropeanFijianFilipinoFinnishFrenchFrench American IndianFrench CanadianGermanGerman RussianGhanaianGreekGuamanian/ChamorroGuatemalanGuyaneseHaitianHmongHonduranHopiHoumaHungarianIcelanderIndian (Asian)IndonesianInupiatIranianIraqiIrishIroquoisIsraeliItalianJamaicanJapaneseJordanianKenyanKiowaKoreanLaotianLatvianLebaneseLiberianLithuanianLumbeeLuxembourgerMacedonianMalaysianMalteseMarshalleseMenomineeMexicanMexican American IndianMongolianMoroccanNative HawaiianNavajoNepaleseNew ZealanderNicaraguanNigerianNorthern EuropeanNorwegianOkinawanOsageOttawaPaiutePakistaniPalestinianPanamanianParaguayanPennsylvania GermanPeruvianPimaPolishPortuguesePotawatomiPuebloPuerto RicanPuget Sound SalishRomanianRussianSalvadoranSamoanScandinavianScotch-IrishScottishSeminoleSenegaleseSerbianShoshoneSierra LeoneanSiouxSlavicSlovakSloveneSomaliSouth AfricanSouth AmericanSouth American IndianSoviet UnionSpaniardSpanishSpanish AmericanSpanish American IndianSri LankanSubsaharan AfricanSudaneseSwedishSwissSyrianTaiwaneseThaiTlingit-HaidaTohono O'OdhamTonganTrinidadian and TobagonianTsimshianTurkishU.S. Virgin IslanderUgandanUkrainianUruguayanUteVenezuelanVietnameseWelshWest IndianYakamaYaquiYugoslavianYumanYup'ikZimbabwean
Immigration
NonimmigrantsImmigrantsAfghanistanAfricaAlbaniaArgentinaArmeniaAsiaAustraliaAustriaBahamasBangladeshBarbadosBelarusBelgiumBelizeBoliviaBosnia and HerzegovinaBrazilBulgariaBurma/MyanmarCabo VerdeCambodiaCameroonCanadaCaribbeanCentral AmericaChileChinaColombiaCongoCosta RicaCubaCzechoslovakiaDenmarkDominicaDominican RepublicEastern AfricaEastern AsiaEastern EuropeEcuadorEgyptEl SalvadorEnglandEritreaEthiopiaEuropeFijiFranceGermanyGhanaGreeceGrenadaGuatemalaGuyanaHaitiHondurasHong KongHungaryIndiaIndonesiaIranIraqIrelandIsraelItalyJamaicaJapanJordanKazakhstanKenyaKoreaKuwaitLaosLatin AmericaLatviaLebanonLiberiaLithuaniaMalaysiaMexicoMicronesiaMiddle AfricaMoldovaMoroccoNepalNetherlandsNicaraguaNigeriaNorth AmericaNorth MacedoniaNorthern AfricaNorthern EuropeNorwayOceaniaPakistanPanamaPeruPhilippinesPolandPortugalRomaniaRussiaSaudi ArabiaScotlandSenegalSerbiaSierra LeoneSingaporeSomaliaSouth AfricaSouth AmericaSouth Central AsiaSouth Eastern AsiaSouthern EuropeSpainSri LankaSt. Vincent and the GrenadinesSudanSwedenSwitzerlandSyriaTaiwanThailandTrinidad and TobagoTurkeyUgandaUkraineUruguayUzbekistanVenezuelaVietnamWest IndiesWestern AfricaWestern AsiaWestern EuropeYemenZaireZimbabweAzores
Nursery School
Income
Poverty
Unemployment
Labor Participation
Family Structure
Vehicle Availability
Education Level
Disability

Nursery School Comparison

Immigrants from Croatia

Immigrants from Sudan

Exceptional
Tragic
98.2%
NURSERY SCHOOL
91.4/ 100
METRIC RATING
130th/ 347
METRIC RANK
97.7%
NURSERY SCHOOL
3.9/ 100
METRIC RATING
223rd/ 347
METRIC RANK

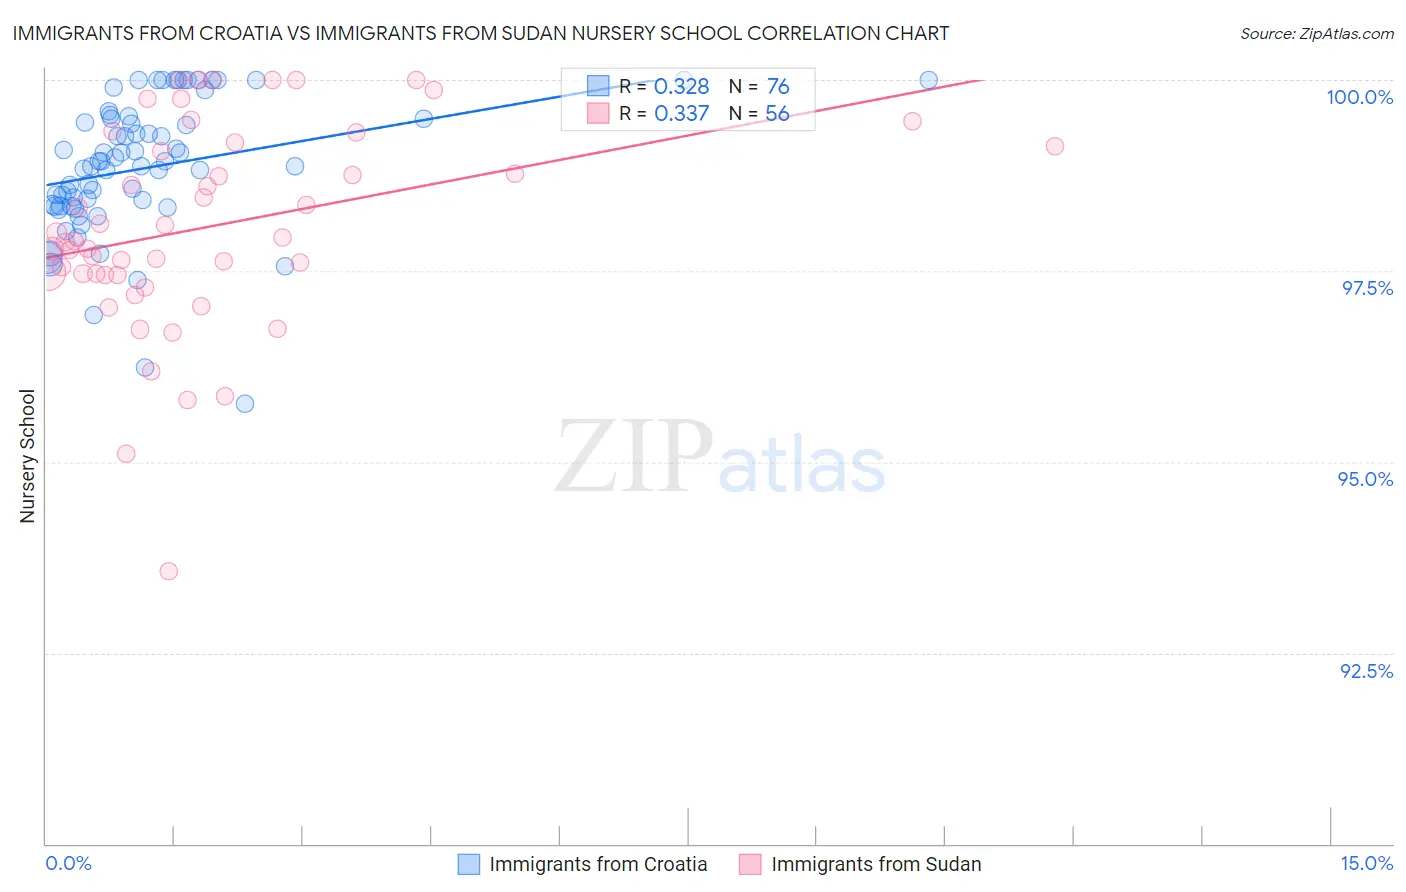
Immigrants from Croatia vs Immigrants from Sudan Nursery School Correlation Chart

The statistical analysis conducted on geographies consisting of 132,538,077 people shows a mild positive correlation between the proportion of Immigrants from Croatia and percentage of population with at least nursery school education in the United States with a correlation coefficient (R) of 0.328 and weighted average of 98.2%. Similarly, the statistical analysis conducted on geographies consisting of 118,957,985 people shows a mild positive correlation between the proportion of Immigrants from Sudan and percentage of population with at least nursery school education in the United States with a correlation coefficient (R) of 0.337 and weighted average of 97.7%, a difference of 0.42%.
Immigrants from Croatia vs Immigrants from Sudan Nursery School

Nursery School Correlation Summary

MeasurementImmigrants from CroatiaImmigrants from Sudan
Minimum95.8%93.6%
Maximum100.0%100.0%
Range4.2%6.4%
Mean98.9%98.1%
Median98.9%97.9%
Interquartile 25% (IQ1)98.4%97.5%
Interquartile 75% (IQ3)99.5%99.2%
Interquartile Range (IQR)1.1%1.7%
Standard Deviation (Sample)0.89%1.3%
Standard Deviation (Population)0.88%1.3%

Similar Demographics by Nursery School

Demographics Similar to Immigrants from Croatia by Nursery School

In terms of nursery school, the demographic groups most similar to Immigrants from Croatia are Cambodian (98.2%, a difference of 0.0%), Spaniard (98.2%, a difference of 0.0%), Seminole (98.2%, a difference of 0.0%), Immigrants from Serbia (98.2%, a difference of 0.010%), and Immigrants from Europe (98.1%, a difference of 0.010%).
DemographicsRating | RankNursery School
Syrians
93.9
/100
|
#123
Exceptional
98.2%
Lebanese
93.8
/100
|
#124
Exceptional
98.2%
Iroquois
93.7
/100
|
#125
Exceptional
98.2%
Menominee
93.6
/100
|
#126
Exceptional
98.2%
Immigrants | Saudi Arabia
93.4
/100
|
#127
Exceptional
98.2%
Immigrants | Serbia
92.4
/100
|
#128
Exceptional
98.2%
Cambodians
91.4
/100
|
#129
Exceptional
98.2%
Immigrants | Croatia
91.4
/100
|
#130
Exceptional
98.2%
Spaniards
91.1
/100
|
#131
Exceptional
98.2%
Seminole
90.9
/100
|
#132
Exceptional
98.2%
Immigrants | Europe
90.7
/100
|
#133
Exceptional
98.1%
Immigrants | Bulgaria
89.4
/100
|
#134
Excellent
98.1%
Immigrants | Hungary
89.3
/100
|
#135
Excellent
98.1%
Immigrants | Kuwait
88.9
/100
|
#136
Excellent
98.1%
Israelis
88.2
/100
|
#137
Excellent
98.1%

Demographics Similar to Immigrants from Sudan by Nursery School

In terms of nursery school, the demographic groups most similar to Immigrants from Sudan are Immigrants from Syria (97.7%, a difference of 0.0%), Immigrants from Zaire (97.8%, a difference of 0.010%), Tongan (97.8%, a difference of 0.010%), Immigrants from Nepal (97.7%, a difference of 0.010%), and Immigrants from Costa Rica (97.7%, a difference of 0.010%).
DemographicsRating | RankNursery School
Uruguayans
7.1
/100
|
#216
Tragic
97.8%
Samoans
6.3
/100
|
#217
Tragic
97.8%
Immigrants | Panama
5.3
/100
|
#218
Tragic
97.8%
Immigrants | Morocco
5.1
/100
|
#219
Tragic
97.8%
Immigrants | Zaire
4.4
/100
|
#220
Tragic
97.8%
Tongans
4.3
/100
|
#221
Tragic
97.8%
Immigrants | Syria
4.0
/100
|
#222
Tragic
97.7%
Immigrants | Sudan
3.9
/100
|
#223
Tragic
97.7%
Immigrants | Nepal
3.6
/100
|
#224
Tragic
97.7%
Immigrants | Costa Rica
3.5
/100
|
#225
Tragic
97.7%
Iraqis
3.5
/100
|
#226
Tragic
97.7%
Sub-Saharan Africans
3.2
/100
|
#227
Tragic
97.7%
Sudanese
3.2
/100
|
#228
Tragic
97.7%
Senegalese
3.2
/100
|
#229
Tragic
97.7%
Sierra Leoneans
2.9
/100
|
#230
Tragic
97.7%