Immigrants from Costa Rica vs French Canadian 6th Grade
COMPARE
Immigrants from Costa Rica
French Canadian
6th Grade
6th Grade Comparison
Immigrants from Costa Rica
French Canadians
96.6%
6TH GRADE
1.3/ 100
METRIC RATING
245th/ 347
METRIC RANK
98.0%
6TH GRADE
100.0/ 100
METRIC RATING
30th/ 347
METRIC RANK
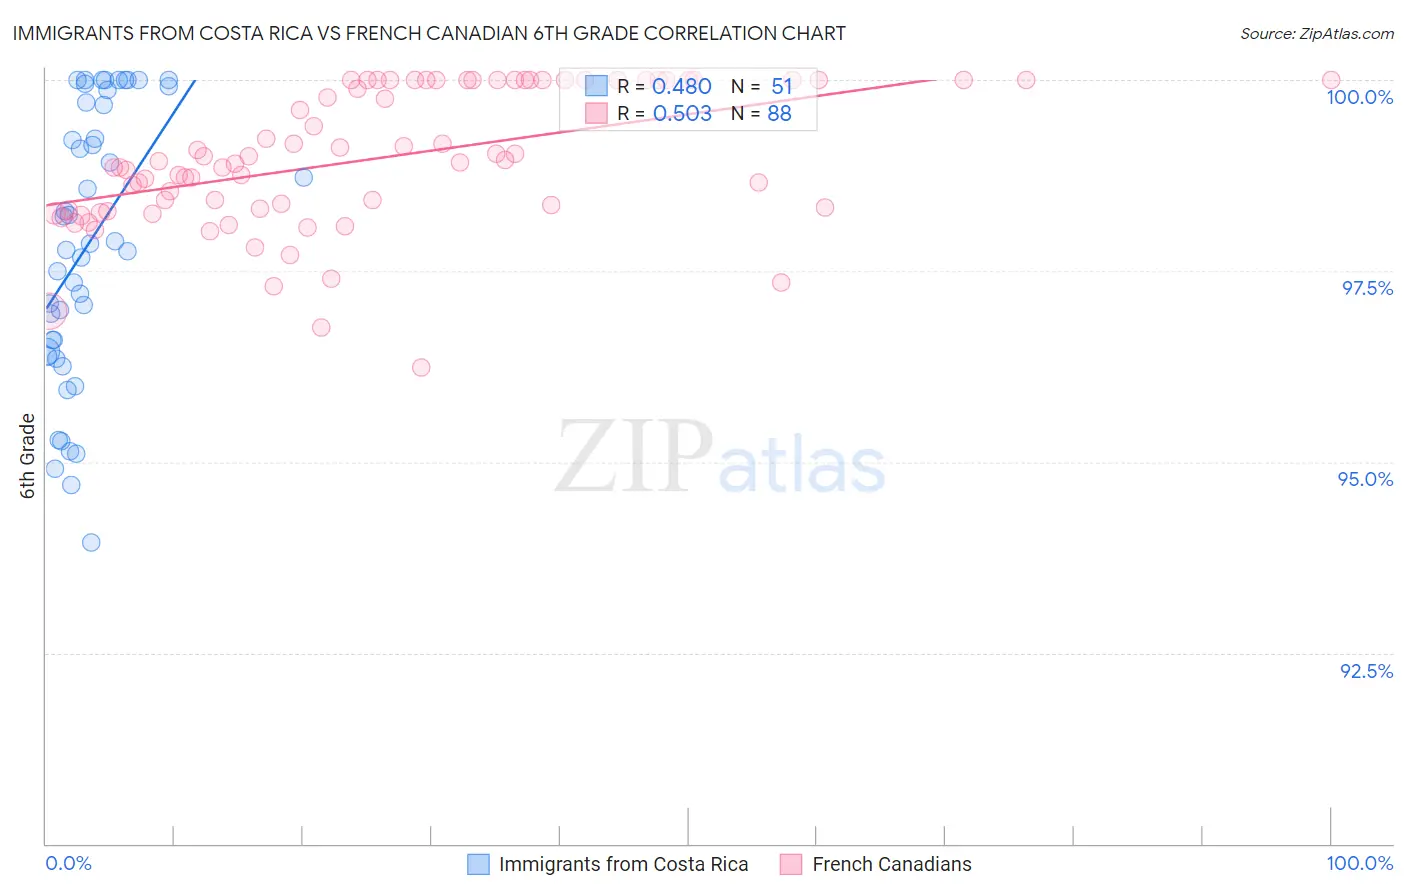
Immigrants from Costa Rica vs French Canadian 6th Grade Correlation Chart
The statistical analysis conducted on geographies consisting of 204,275,869 people shows a moderate positive correlation between the proportion of Immigrants from Costa Rica and percentage of population with at least 6th grade education in the United States with a correlation coefficient (R) of 0.480 and weighted average of 96.6%. Similarly, the statistical analysis conducted on geographies consisting of 502,679,457 people shows a substantial positive correlation between the proportion of French Canadians and percentage of population with at least 6th grade education in the United States with a correlation coefficient (R) of 0.503 and weighted average of 98.0%, a difference of 1.5%.
6th Grade Correlation Summary
| Measurement | Immigrants from Costa Rica | French Canadian |
| Minimum | 93.9% | 96.2% |
| Maximum | 100.0% | 100.0% |
| Range | 6.1% | 3.8% |
| Mean | 97.9% | 99.0% |
| Median | 97.9% | 98.9% |
| Interquartile 25% (IQ1) | 96.4% | 98.3% |
| Interquartile 75% (IQ3) | 99.7% | 100.0% |
| Interquartile Range (IQR) | 3.3% | 1.7% |
| Standard Deviation (Sample) | 1.8% | 0.90% |
| Standard Deviation (Population) | 1.7% | 0.90% |
Similar Demographics by 6th Grade
Demographics Similar to Immigrants from Costa Rica by 6th Grade
In terms of 6th grade, the demographic groups most similar to Immigrants from Costa Rica are Immigrants from Africa (96.6%, a difference of 0.0%), Ethiopian (96.6%, a difference of 0.020%), Immigrants from Liberia (96.6%, a difference of 0.030%), Bolivian (96.5%, a difference of 0.030%), and Nigerian (96.6%, a difference of 0.040%).
| Demographics | Rating | Rank | 6th Grade |
| Nigerians | 1.9 /100 | #238 | Tragic 96.6% |
| Indians (Asian) | 1.9 /100 | #239 | Tragic 96.6% |
| Koreans | 1.9 /100 | #240 | Tragic 96.6% |
| Senegalese | 1.8 /100 | #241 | Tragic 96.6% |
| Immigrants | Asia | 1.8 /100 | #242 | Tragic 96.6% |
| Immigrants | Liberia | 1.6 /100 | #243 | Tragic 96.6% |
| Ethiopians | 1.5 /100 | #244 | Tragic 96.6% |
| Immigrants | Costa Rica | 1.3 /100 | #245 | Tragic 96.6% |
| Immigrants | Africa | 1.3 /100 | #246 | Tragic 96.6% |
| Bolivians | 1.0 /100 | #247 | Tragic 96.5% |
| Tohono O'odham | 1.0 /100 | #248 | Tragic 96.5% |
| Colombians | 0.9 /100 | #249 | Tragic 96.5% |
| Immigrants | Middle Africa | 0.8 /100 | #250 | Tragic 96.5% |
| Immigrants | Senegal | 0.7 /100 | #251 | Tragic 96.5% |
| Immigrants | Uruguay | 0.6 /100 | #252 | Tragic 96.5% |
Demographics Similar to French Canadians by 6th Grade
In terms of 6th grade, the demographic groups most similar to French Canadians are European (98.0%, a difference of 0.0%), Yup'ik (98.0%, a difference of 0.010%), Scandinavian (98.0%, a difference of 0.010%), French (98.0%, a difference of 0.010%), and Alaska Native (98.0%, a difference of 0.010%).
| Demographics | Rating | Rank | 6th Grade |
| Sioux | 100.0 /100 | #23 | Exceptional 98.0% |
| Croatians | 100.0 /100 | #24 | Exceptional 98.0% |
| Scotch-Irish | 100.0 /100 | #25 | Exceptional 98.0% |
| Czechs | 100.0 /100 | #26 | Exceptional 98.0% |
| Yup'ik | 100.0 /100 | #27 | Exceptional 98.0% |
| Scandinavians | 100.0 /100 | #28 | Exceptional 98.0% |
| French | 100.0 /100 | #29 | Exceptional 98.0% |
| French Canadians | 100.0 /100 | #30 | Exceptional 98.0% |
| Europeans | 100.0 /100 | #31 | Exceptional 98.0% |
| Alaska Natives | 100.0 /100 | #32 | Exceptional 98.0% |
| Chippewa | 100.0 /100 | #33 | Exceptional 97.9% |
| Swiss | 100.0 /100 | #34 | Exceptional 97.9% |
| Chinese | 100.0 /100 | #35 | Exceptional 97.9% |
| Italians | 100.0 /100 | #36 | Exceptional 97.9% |
| British | 100.0 /100 | #37 | Exceptional 97.9% |