Immigrants from Costa Rica vs Choctaw Kindergarten
COMPARE
Immigrants from Costa Rica
Choctaw
Kindergarten
Kindergarten Comparison
Immigrants from Costa Rica
Choctaw
97.7%
KINDERGARTEN
3.6/ 100
METRIC RATING
227th/ 347
METRIC RANK
98.3%
KINDERGARTEN
98.2/ 100
METRIC RATING
98th/ 347
METRIC RANK
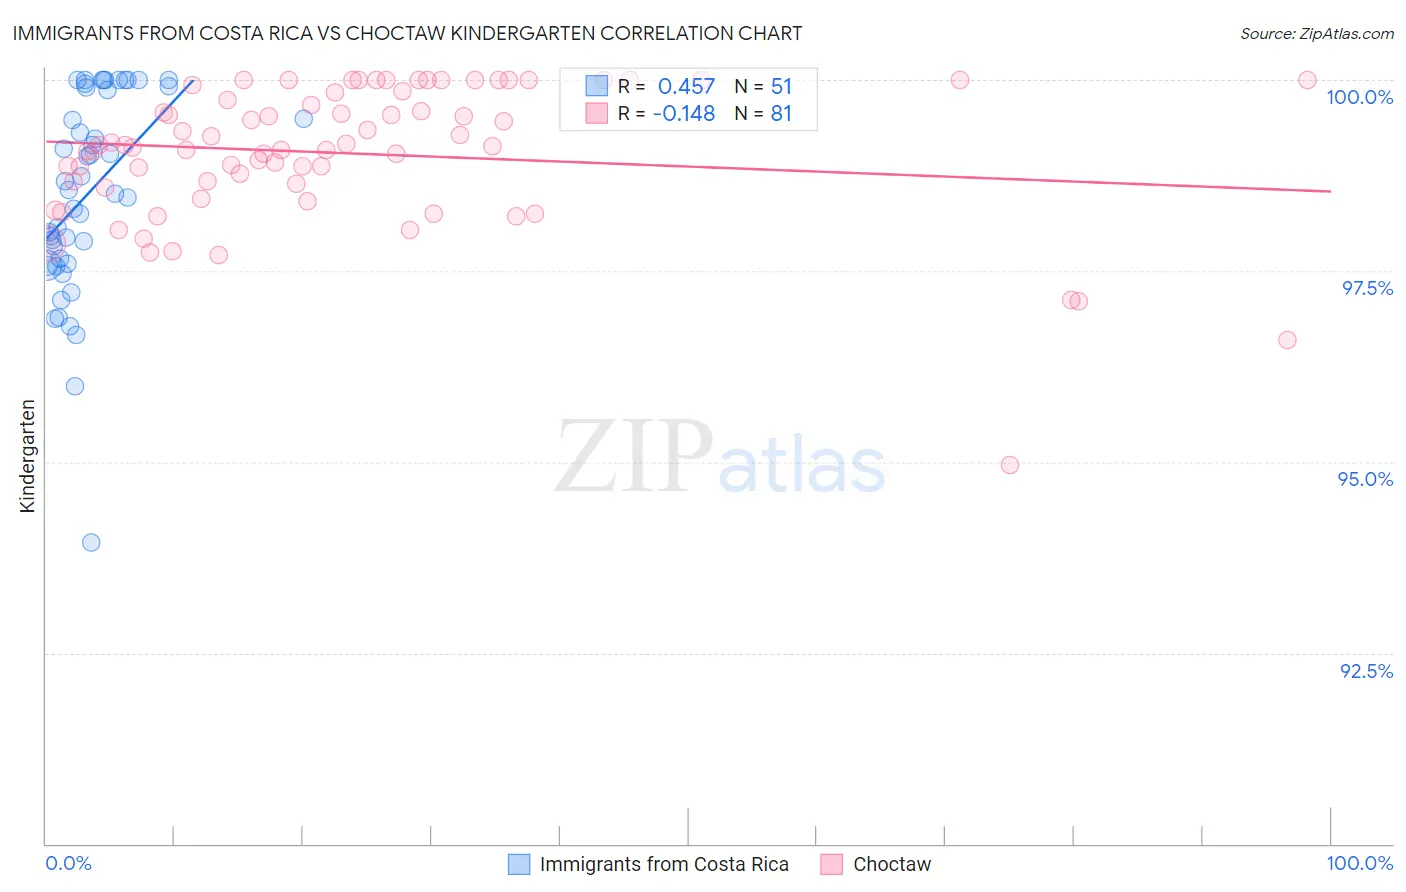
Immigrants from Costa Rica vs Choctaw Kindergarten Correlation Chart
The statistical analysis conducted on geographies consisting of 204,275,869 people shows a moderate positive correlation between the proportion of Immigrants from Costa Rica and percentage of population with at least kindergarten education in the United States with a correlation coefficient (R) of 0.457 and weighted average of 97.7%. Similarly, the statistical analysis conducted on geographies consisting of 269,742,875 people shows a poor negative correlation between the proportion of Choctaw and percentage of population with at least kindergarten education in the United States with a correlation coefficient (R) of -0.148 and weighted average of 98.3%, a difference of 0.57%.
Kindergarten Correlation Summary
| Measurement | Immigrants from Costa Rica | Choctaw |
| Minimum | 93.9% | 95.0% |
| Maximum | 100.0% | 100.0% |
| Range | 6.1% | 5.0% |
| Mean | 98.5% | 99.0% |
| Median | 98.6% | 99.1% |
| Interquartile 25% (IQ1) | 97.6% | 98.6% |
| Interquartile 75% (IQ3) | 99.9% | 99.8% |
| Interquartile Range (IQR) | 2.3% | 1.2% |
| Standard Deviation (Sample) | 1.3% | 0.92% |
| Standard Deviation (Population) | 1.3% | 0.91% |
Similar Demographics by Kindergarten
Demographics Similar to Immigrants from Costa Rica by Kindergarten
In terms of kindergarten, the demographic groups most similar to Immigrants from Costa Rica are Sudanese (97.7%, a difference of 0.0%), Subsaharan African (97.7%, a difference of 0.0%), Immigrants from Syria (97.7%, a difference of 0.010%), Iraqi (97.7%, a difference of 0.010%), and Immigrants from Nepal (97.7%, a difference of 0.010%).
| Demographics | Rating | Rank | Kindergarten |
| Tongans | 4.8 /100 | #220 | Tragic 97.7% |
| Immigrants | Zaire | 4.5 /100 | #221 | Tragic 97.7% |
| Immigrants | Sudan | 4.5 /100 | #222 | Tragic 97.7% |
| Immigrants | Syria | 4.3 /100 | #223 | Tragic 97.7% |
| Iraqis | 3.9 /100 | #224 | Tragic 97.7% |
| Immigrants | Nepal | 3.8 /100 | #225 | Tragic 97.7% |
| Sudanese | 3.7 /100 | #226 | Tragic 97.7% |
| Immigrants | Costa Rica | 3.6 /100 | #227 | Tragic 97.7% |
| Sub-Saharan Africans | 3.5 /100 | #228 | Tragic 97.7% |
| Sierra Leoneans | 3.4 /100 | #229 | Tragic 97.7% |
| Senegalese | 3.3 /100 | #230 | Tragic 97.7% |
| Puerto Ricans | 2.7 /100 | #231 | Tragic 97.7% |
| Immigrants | Uruguay | 2.6 /100 | #232 | Tragic 97.7% |
| Immigrants | Pakistan | 2.2 /100 | #233 | Tragic 97.7% |
| Immigrants | Malaysia | 2.2 /100 | #234 | Tragic 97.7% |
Demographics Similar to Choctaw by Kindergarten
In terms of kindergarten, the demographic groups most similar to Choctaw are Nonimmigrants (98.3%, a difference of 0.0%), Cypriot (98.3%, a difference of 0.0%), Colville (98.3%, a difference of 0.0%), South African (98.3%, a difference of 0.010%), and Immigrants from Germany (98.3%, a difference of 0.010%).
| Demographics | Rating | Rank | Kindergarten |
| Immigrants | Western Europe | 98.8 /100 | #91 | Exceptional 98.3% |
| Macedonians | 98.7 /100 | #92 | Exceptional 98.3% |
| Immigrants | India | 98.6 /100 | #93 | Exceptional 98.3% |
| South Africans | 98.5 /100 | #94 | Exceptional 98.3% |
| Immigrants | Germany | 98.5 /100 | #95 | Exceptional 98.3% |
| Immigrants | Nonimmigrants | 98.3 /100 | #96 | Exceptional 98.3% |
| Cypriots | 98.3 /100 | #97 | Exceptional 98.3% |
| Choctaw | 98.2 /100 | #98 | Exceptional 98.3% |
| Colville | 98.2 /100 | #99 | Exceptional 98.3% |
| Puget Sound Salish | 98.1 /100 | #100 | Exceptional 98.2% |
| Romanians | 97.8 /100 | #101 | Exceptional 98.2% |
| Cree | 97.7 /100 | #102 | Exceptional 98.2% |
| Immigrants | Ireland | 97.6 /100 | #103 | Exceptional 98.2% |
| Bhutanese | 97.3 /100 | #104 | Exceptional 98.2% |
| Pima | 97.3 /100 | #105 | Exceptional 98.2% |