Immigrants from Congo vs Latvian 2nd Grade
COMPARE
Immigrants from Congo
Latvian
2nd Grade
2nd Grade Comparison
Immigrants from Congo
Latvians
97.5%
2ND GRADE
0.6/ 100
METRIC RATING
255th/ 347
METRIC RANK
98.4%
2ND GRADE
99.9/ 100
METRIC RATING
38th/ 347
METRIC RANK
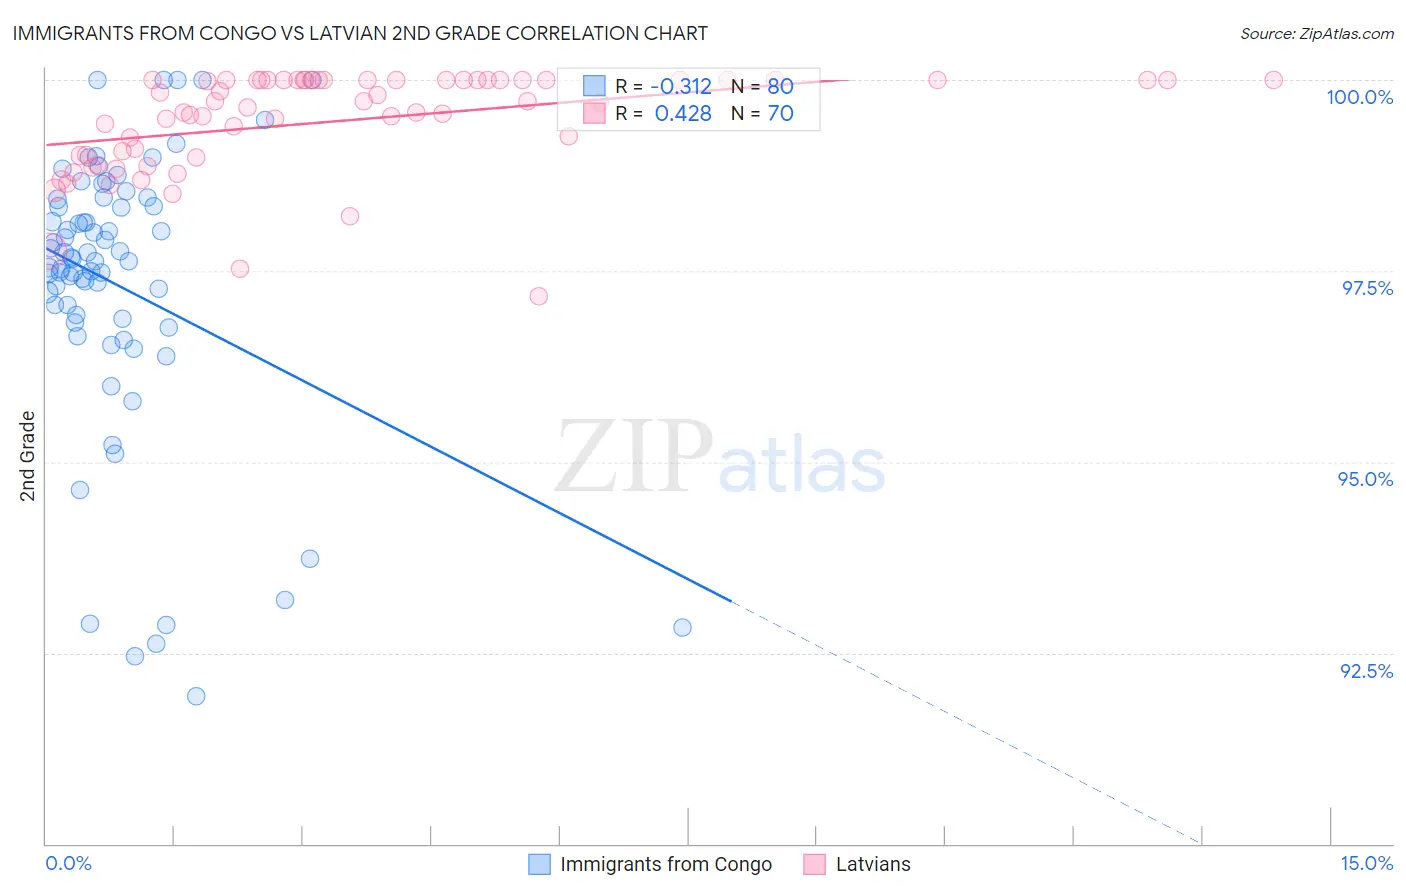
Immigrants from Congo vs Latvian 2nd Grade Correlation Chart
The statistical analysis conducted on geographies consisting of 92,124,753 people shows a mild negative correlation between the proportion of Immigrants from Congo and percentage of population with at least 2nd grade education in the United States with a correlation coefficient (R) of -0.312 and weighted average of 97.5%. Similarly, the statistical analysis conducted on geographies consisting of 220,726,452 people shows a moderate positive correlation between the proportion of Latvians and percentage of population with at least 2nd grade education in the United States with a correlation coefficient (R) of 0.428 and weighted average of 98.4%, a difference of 0.99%.
2nd Grade Correlation Summary
| Measurement | Immigrants from Congo | Latvian |
| Minimum | 91.9% | 97.2% |
| Maximum | 100.0% | 100.0% |
| Range | 8.1% | 2.8% |
| Mean | 97.3% | 99.5% |
| Median | 97.6% | 99.7% |
| Interquartile 25% (IQ1) | 96.8% | 99.0% |
| Interquartile 75% (IQ3) | 98.4% | 100.0% |
| Interquartile Range (IQR) | 1.5% | 0.99% |
| Standard Deviation (Sample) | 1.8% | 0.66% |
| Standard Deviation (Population) | 1.8% | 0.66% |
Similar Demographics by 2nd Grade
Demographics Similar to Immigrants from Congo by 2nd Grade
In terms of 2nd grade, the demographic groups most similar to Immigrants from Congo are Indian (Asian) (97.5%, a difference of 0.0%), Jamaican (97.5%, a difference of 0.0%), Puerto Rican (97.5%, a difference of 0.010%), Immigrants from Colombia (97.5%, a difference of 0.010%), and Yaqui (97.5%, a difference of 0.010%).
| Demographics | Rating | Rank | 2nd Grade |
| Immigrants | Middle Africa | 0.9 /100 | #248 | Tragic 97.5% |
| Bolivians | 0.9 /100 | #249 | Tragic 97.5% |
| Peruvians | 0.9 /100 | #250 | Tragic 97.5% |
| Immigrants | Africa | 0.8 /100 | #251 | Tragic 97.5% |
| Immigrants | Asia | 0.7 /100 | #252 | Tragic 97.5% |
| Puerto Ricans | 0.7 /100 | #253 | Tragic 97.5% |
| Indians (Asian) | 0.6 /100 | #254 | Tragic 97.5% |
| Immigrants | Congo | 0.6 /100 | #255 | Tragic 97.5% |
| Jamaicans | 0.6 /100 | #256 | Tragic 97.5% |
| Immigrants | Colombia | 0.5 /100 | #257 | Tragic 97.5% |
| Yaqui | 0.5 /100 | #258 | Tragic 97.5% |
| Fijians | 0.5 /100 | #259 | Tragic 97.5% |
| Assyrians/Chaldeans/Syriacs | 0.5 /100 | #260 | Tragic 97.5% |
| Armenians | 0.5 /100 | #261 | Tragic 97.5% |
| Taiwanese | 0.4 /100 | #262 | Tragic 97.4% |
Demographics Similar to Latvians by 2nd Grade
In terms of 2nd grade, the demographic groups most similar to Latvians are Chippewa (98.4%, a difference of 0.0%), Italian (98.4%, a difference of 0.010%), Luxembourger (98.4%, a difference of 0.010%), Eastern European (98.4%, a difference of 0.010%), and Native Hawaiian (98.4%, a difference of 0.020%).
| Demographics | Rating | Rank | 2nd Grade |
| Czechs | 100.0 /100 | #31 | Exceptional 98.5% |
| French Canadians | 100.0 /100 | #32 | Exceptional 98.5% |
| Scandinavians | 100.0 /100 | #33 | Exceptional 98.5% |
| Chinese | 100.0 /100 | #34 | Exceptional 98.5% |
| Swiss | 100.0 /100 | #35 | Exceptional 98.5% |
| British | 100.0 /100 | #36 | Exceptional 98.5% |
| Italians | 99.9 /100 | #37 | Exceptional 98.4% |
| Latvians | 99.9 /100 | #38 | Exceptional 98.4% |
| Chippewa | 99.9 /100 | #39 | Exceptional 98.4% |
| Luxembourgers | 99.9 /100 | #40 | Exceptional 98.4% |
| Eastern Europeans | 99.9 /100 | #41 | Exceptional 98.4% |
| Native Hawaiians | 99.9 /100 | #42 | Exceptional 98.4% |
| Belgians | 99.9 /100 | #43 | Exceptional 98.4% |
| Northern Europeans | 99.9 /100 | #44 | Exceptional 98.4% |
| Hungarians | 99.9 /100 | #45 | Exceptional 98.4% |