Immigrants from Congo vs British West Indian 4th Grade
COMPARE
Immigrants from Congo
British West Indian
4th Grade
4th Grade Comparison
Immigrants from Congo
British West Indians
97.0%
4TH GRADE
0.5/ 100
METRIC RATING
257th/ 347
METRIC RANK
96.7%
4TH GRADE
0.0/ 100
METRIC RATING
290th/ 347
METRIC RANK
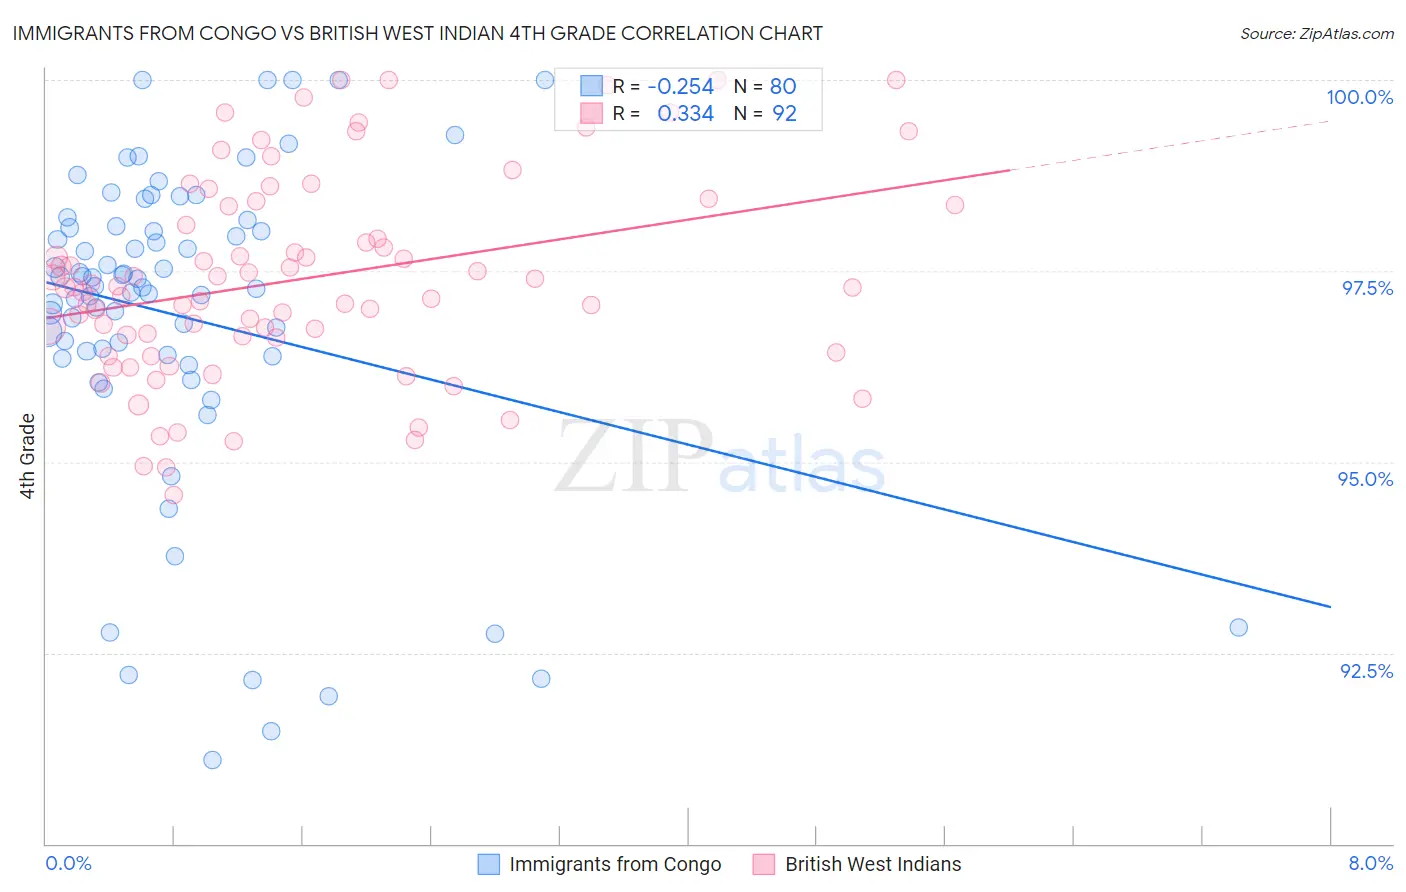
Immigrants from Congo vs British West Indian 4th Grade Correlation Chart
The statistical analysis conducted on geographies consisting of 92,124,753 people shows a weak negative correlation between the proportion of Immigrants from Congo and percentage of population with at least 4th grade education in the United States with a correlation coefficient (R) of -0.254 and weighted average of 97.0%. Similarly, the statistical analysis conducted on geographies consisting of 152,691,173 people shows a mild positive correlation between the proportion of British West Indians and percentage of population with at least 4th grade education in the United States with a correlation coefficient (R) of 0.334 and weighted average of 96.7%, a difference of 0.30%.
4th Grade Correlation Summary
| Measurement | Immigrants from Congo | British West Indian |
| Minimum | 91.1% | 94.6% |
| Maximum | 100.0% | 100.0% |
| Range | 8.9% | 5.4% |
| Mean | 96.9% | 97.4% |
| Median | 97.3% | 97.3% |
| Interquartile 25% (IQ1) | 96.4% | 96.6% |
| Interquartile 75% (IQ3) | 98.1% | 98.4% |
| Interquartile Range (IQR) | 1.7% | 1.7% |
| Standard Deviation (Sample) | 2.1% | 1.3% |
| Standard Deviation (Population) | 2.1% | 1.3% |
Similar Demographics by 4th Grade
Demographics Similar to Immigrants from Congo by 4th Grade
In terms of 4th grade, the demographic groups most similar to Immigrants from Congo are Immigrants from Colombia (97.0%, a difference of 0.0%), Immigrants from Ethiopia (97.0%, a difference of 0.010%), Immigrants from Sierra Leone (97.0%, a difference of 0.020%), Immigrants from South America (97.0%, a difference of 0.020%), and West Indian (97.0%, a difference of 0.030%).
| Demographics | Rating | Rank | 4th Grade |
| Immigrants | Senegal | 0.9 /100 | #250 | Tragic 97.1% |
| South Americans | 0.8 /100 | #251 | Tragic 97.1% |
| Jamaicans | 0.8 /100 | #252 | Tragic 97.1% |
| Immigrants | Liberia | 0.8 /100 | #253 | Tragic 97.1% |
| Immigrants | Middle Africa | 0.8 /100 | #254 | Tragic 97.1% |
| Peruvians | 0.7 /100 | #255 | Tragic 97.1% |
| Bolivians | 0.7 /100 | #256 | Tragic 97.1% |
| Immigrants | Congo | 0.5 /100 | #257 | Tragic 97.0% |
| Immigrants | Colombia | 0.5 /100 | #258 | Tragic 97.0% |
| Immigrants | Ethiopia | 0.4 /100 | #259 | Tragic 97.0% |
| Immigrants | Sierra Leone | 0.4 /100 | #260 | Tragic 97.0% |
| Immigrants | South America | 0.4 /100 | #261 | Tragic 97.0% |
| West Indians | 0.4 /100 | #262 | Tragic 97.0% |
| Immigrants | Jamaica | 0.3 /100 | #263 | Tragic 97.0% |
| Taiwanese | 0.3 /100 | #264 | Tragic 97.0% |
Demographics Similar to British West Indians by 4th Grade
In terms of 4th grade, the demographic groups most similar to British West Indians are Immigrants from West Indies (96.7%, a difference of 0.010%), Houma (96.8%, a difference of 0.030%), Immigrants from Afghanistan (96.8%, a difference of 0.030%), Immigrants from Grenada (96.7%, a difference of 0.030%), and Malaysian (96.7%, a difference of 0.040%).
| Demographics | Rating | Rank | 4th Grade |
| Immigrants | Philippines | 0.1 /100 | #283 | Tragic 96.8% |
| Immigrants | St. Vincent and the Grenadines | 0.1 /100 | #284 | Tragic 96.8% |
| Immigrants | Barbados | 0.0 /100 | #285 | Tragic 96.8% |
| Immigrants | Thailand | 0.0 /100 | #286 | Tragic 96.8% |
| Houma | 0.0 /100 | #287 | Tragic 96.8% |
| Immigrants | Afghanistan | 0.0 /100 | #288 | Tragic 96.8% |
| Immigrants | West Indies | 0.0 /100 | #289 | Tragic 96.7% |
| British West Indians | 0.0 /100 | #290 | Tragic 96.7% |
| Immigrants | Grenada | 0.0 /100 | #291 | Tragic 96.7% |
| Malaysians | 0.0 /100 | #292 | Tragic 96.7% |
| Puerto Ricans | 0.0 /100 | #293 | Tragic 96.7% |
| Immigrants | Eritrea | 0.0 /100 | #294 | Tragic 96.7% |
| Immigrants | Portugal | 0.0 /100 | #295 | Tragic 96.6% |
| Somalis | 0.0 /100 | #296 | Tragic 96.6% |
| Immigrants | Somalia | 0.0 /100 | #297 | Tragic 96.5% |