Immigrants from Colombia vs Immigrants from Pakistan 3rd Grade
COMPARE
Immigrants from Colombia
Immigrants from Pakistan
3rd Grade
3rd Grade Comparison
Immigrants from Colombia
Immigrants from Pakistan
97.3%
3RD GRADE
0.5/ 100
METRIC RATING
257th/ 347
METRIC RANK
97.5%
3RD GRADE
2.7/ 100
METRIC RATING
230th/ 347
METRIC RANK
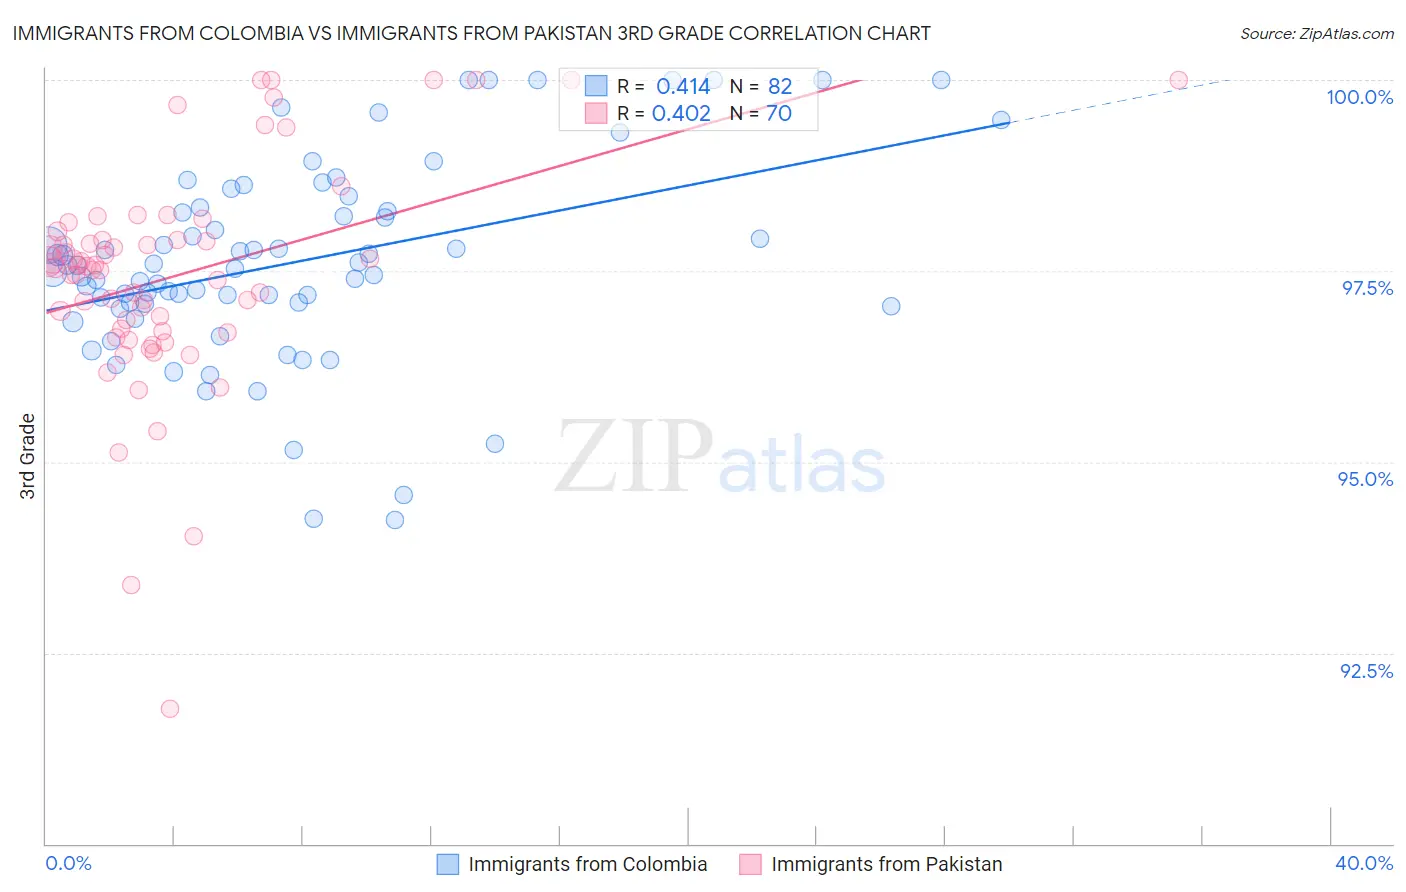
Immigrants from Colombia vs Immigrants from Pakistan 3rd Grade Correlation Chart
The statistical analysis conducted on geographies consisting of 378,643,693 people shows a moderate positive correlation between the proportion of Immigrants from Colombia and percentage of population with at least 3rd grade education in the United States with a correlation coefficient (R) of 0.414 and weighted average of 97.3%. Similarly, the statistical analysis conducted on geographies consisting of 283,900,606 people shows a moderate positive correlation between the proportion of Immigrants from Pakistan and percentage of population with at least 3rd grade education in the United States with a correlation coefficient (R) of 0.402 and weighted average of 97.5%, a difference of 0.14%.
3rd Grade Correlation Summary
| Measurement | Immigrants from Colombia | Immigrants from Pakistan |
| Minimum | 94.2% | 91.8% |
| Maximum | 100.0% | 100.0% |
| Range | 5.8% | 8.2% |
| Mean | 97.6% | 97.4% |
| Median | 97.5% | 97.6% |
| Interquartile 25% (IQ1) | 97.1% | 96.7% |
| Interquartile 75% (IQ3) | 98.3% | 97.9% |
| Interquartile Range (IQR) | 1.2% | 1.2% |
| Standard Deviation (Sample) | 1.3% | 1.5% |
| Standard Deviation (Population) | 1.3% | 1.5% |
Similar Demographics by 3rd Grade
Demographics Similar to Immigrants from Colombia by 3rd Grade
In terms of 3rd grade, the demographic groups most similar to Immigrants from Colombia are Bolivian (97.3%, a difference of 0.010%), Immigrants from Congo (97.3%, a difference of 0.010%), Immigrants from Liberia (97.3%, a difference of 0.010%), Armenian (97.3%, a difference of 0.020%), and Immigrants from Ethiopia (97.3%, a difference of 0.020%).
| Demographics | Rating | Rank | 3rd Grade |
| Immigrants | Middle Africa | 0.9 /100 | #250 | Tragic 97.4% |
| Immigrants | Asia | 0.8 /100 | #251 | Tragic 97.4% |
| Peruvians | 0.8 /100 | #252 | Tragic 97.4% |
| Immigrants | Africa | 0.8 /100 | #253 | Tragic 97.4% |
| Jamaicans | 0.7 /100 | #254 | Tragic 97.4% |
| Bolivians | 0.6 /100 | #255 | Tragic 97.3% |
| Immigrants | Congo | 0.6 /100 | #256 | Tragic 97.3% |
| Immigrants | Colombia | 0.5 /100 | #257 | Tragic 97.3% |
| Immigrants | Liberia | 0.5 /100 | #258 | Tragic 97.3% |
| Armenians | 0.4 /100 | #259 | Tragic 97.3% |
| Immigrants | Ethiopia | 0.4 /100 | #260 | Tragic 97.3% |
| Immigrants | South America | 0.4 /100 | #261 | Tragic 97.3% |
| Immigrants | Sierra Leone | 0.4 /100 | #262 | Tragic 97.3% |
| Taiwanese | 0.3 /100 | #263 | Tragic 97.3% |
| West Indians | 0.3 /100 | #264 | Tragic 97.3% |
Demographics Similar to Immigrants from Pakistan by 3rd Grade
In terms of 3rd grade, the demographic groups most similar to Immigrants from Pakistan are Immigrants from Costa Rica (97.5%, a difference of 0.0%), Subsaharan African (97.5%, a difference of 0.010%), Senegalese (97.5%, a difference of 0.010%), Immigrants from Western Asia (97.5%, a difference of 0.010%), and Immigrants from Malaysia (97.5%, a difference of 0.010%).
| Demographics | Rating | Rank | 3rd Grade |
| Immigrants | Syria | 4.4 /100 | #223 | Tragic 97.5% |
| Bahamians | 4.4 /100 | #224 | Tragic 97.5% |
| Tongans | 4.3 /100 | #225 | Tragic 97.5% |
| Sudanese | 4.1 /100 | #226 | Tragic 97.5% |
| Immigrants | Sudan | 3.4 /100 | #227 | Tragic 97.5% |
| Sub-Saharan Africans | 3.2 /100 | #228 | Tragic 97.5% |
| Senegalese | 3.0 /100 | #229 | Tragic 97.5% |
| Immigrants | Pakistan | 2.7 /100 | #230 | Tragic 97.5% |
| Immigrants | Costa Rica | 2.7 /100 | #231 | Tragic 97.5% |
| Immigrants | Western Asia | 2.6 /100 | #232 | Tragic 97.5% |
| Immigrants | Malaysia | 2.4 /100 | #233 | Tragic 97.5% |
| Immigrants | Eastern Asia | 1.9 /100 | #234 | Tragic 97.4% |
| Immigrants | Iraq | 1.8 /100 | #235 | Tragic 97.4% |
| Liberians | 1.8 /100 | #236 | Tragic 97.4% |
| Colombians | 1.8 /100 | #237 | Tragic 97.4% |