Immigrants from Colombia vs Immigrants from Hong Kong College, Under 1 year
COMPARE
Immigrants from Colombia
Immigrants from Hong Kong
College, Under 1 year
College, Under 1 year Comparison
Immigrants from Colombia
Immigrants from Hong Kong
63.1%
COLLEGE, UNDER 1 YEAR
4.0/ 100
METRIC RATING
226th/ 347
METRIC RANK
71.0%
COLLEGE, UNDER 1 YEAR
100.0/ 100
METRIC RATING
28th/ 347
METRIC RANK
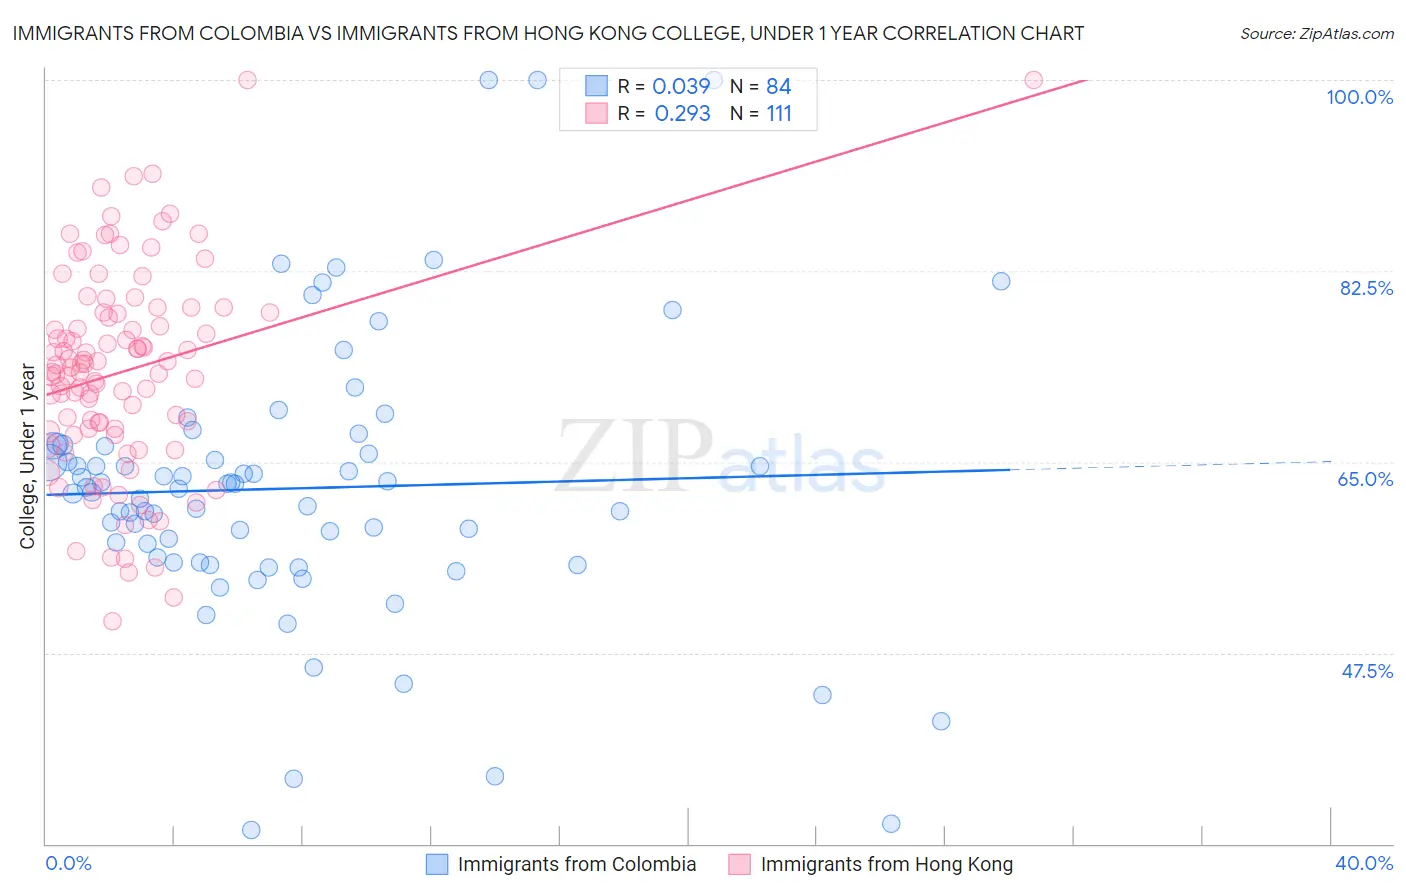
Immigrants from Colombia vs Immigrants from Hong Kong College, Under 1 year Correlation Chart
The statistical analysis conducted on geographies consisting of 378,689,260 people shows no correlation between the proportion of Immigrants from Colombia and percentage of population with at least college, under 1 year education in the United States with a correlation coefficient (R) of 0.039 and weighted average of 63.1%. Similarly, the statistical analysis conducted on geographies consisting of 253,990,081 people shows a weak positive correlation between the proportion of Immigrants from Hong Kong and percentage of population with at least college, under 1 year education in the United States with a correlation coefficient (R) of 0.293 and weighted average of 71.0%, a difference of 12.5%.
College, Under 1 year Correlation Summary
| Measurement | Immigrants from Colombia | Immigrants from Hong Kong |
| Minimum | 31.3% | 50.4% |
| Maximum | 100.0% | 100.0% |
| Range | 68.7% | 49.6% |
| Mean | 62.6% | 73.3% |
| Median | 62.6% | 73.6% |
| Interquartile 25% (IQ1) | 56.0% | 67.8% |
| Interquartile 75% (IQ3) | 66.5% | 78.7% |
| Interquartile Range (IQR) | 10.4% | 10.9% |
| Standard Deviation (Sample) | 12.8% | 9.4% |
| Standard Deviation (Population) | 12.7% | 9.4% |
Similar Demographics by College, Under 1 year
Demographics Similar to Immigrants from Colombia by College, Under 1 year
In terms of college, under 1 year, the demographic groups most similar to Immigrants from Colombia are Immigrants from Peru (63.1%, a difference of 0.020%), Immigrants from Ghana (63.1%, a difference of 0.090%), Subsaharan African (63.2%, a difference of 0.12%), Immigrants from Costa Rica (63.2%, a difference of 0.15%), and Samoan (63.0%, a difference of 0.20%).
| Demographics | Rating | Rank | College, Under 1 year |
| Immigrants | Fiji | 5.7 /100 | #219 | Tragic 63.4% |
| Portuguese | 5.6 /100 | #220 | Tragic 63.4% |
| Cree | 5.2 /100 | #221 | Tragic 63.3% |
| Immigrants | Senegal | 5.0 /100 | #222 | Tragic 63.3% |
| Immigrants | Costa Rica | 4.5 /100 | #223 | Tragic 63.2% |
| Sub-Saharan Africans | 4.4 /100 | #224 | Tragic 63.2% |
| Immigrants | Peru | 4.0 /100 | #225 | Tragic 63.1% |
| Immigrants | Colombia | 4.0 /100 | #226 | Tragic 63.1% |
| Immigrants | Ghana | 3.7 /100 | #227 | Tragic 63.1% |
| Samoans | 3.3 /100 | #228 | Tragic 63.0% |
| Liberians | 3.2 /100 | #229 | Tragic 63.0% |
| Immigrants | Nonimmigrants | 3.0 /100 | #230 | Tragic 62.9% |
| Immigrants | Western Africa | 2.4 /100 | #231 | Tragic 62.8% |
| Osage | 2.2 /100 | #232 | Tragic 62.7% |
| Iroquois | 2.0 /100 | #233 | Tragic 62.6% |
Demographics Similar to Immigrants from Hong Kong by College, Under 1 year
In terms of college, under 1 year, the demographic groups most similar to Immigrants from Hong Kong are Immigrants from France (71.0%, a difference of 0.0%), Immigrants from Denmark (71.0%, a difference of 0.030%), Immigrants from Ireland (71.0%, a difference of 0.030%), Bulgarian (71.1%, a difference of 0.15%), and Soviet Union (71.1%, a difference of 0.17%).
| Demographics | Rating | Rank | College, Under 1 year |
| Immigrants | Belgium | 100.0 /100 | #21 | Exceptional 71.5% |
| Immigrants | Eastern Asia | 100.0 /100 | #22 | Exceptional 71.3% |
| Immigrants | Northern Europe | 100.0 /100 | #23 | Exceptional 71.1% |
| Soviet Union | 100.0 /100 | #24 | Exceptional 71.1% |
| Bulgarians | 100.0 /100 | #25 | Exceptional 71.1% |
| Immigrants | Denmark | 100.0 /100 | #26 | Exceptional 71.0% |
| Immigrants | Ireland | 100.0 /100 | #27 | Exceptional 71.0% |
| Immigrants | Hong Kong | 100.0 /100 | #28 | Exceptional 71.0% |
| Immigrants | France | 100.0 /100 | #29 | Exceptional 71.0% |
| Immigrants | China | 99.9 /100 | #30 | Exceptional 70.9% |
| Indians (Asian) | 99.9 /100 | #31 | Exceptional 70.8% |
| Turks | 99.9 /100 | #32 | Exceptional 70.7% |
| Immigrants | South Africa | 99.9 /100 | #33 | Exceptional 70.6% |
| Estonians | 99.9 /100 | #34 | Exceptional 70.6% |
| Russians | 99.9 /100 | #35 | Exceptional 70.5% |