Immigrants from Colombia vs Immigrants from Ghana 5th Grade
COMPARE
Immigrants from Colombia
Immigrants from Ghana
5th Grade
5th Grade Comparison
Immigrants from Colombia
Immigrants from Ghana
96.8%
5TH GRADE
0.4/ 100
METRIC RATING
262nd/ 347
METRIC RANK
96.6%
5TH GRADE
0.1/ 100
METRIC RATING
278th/ 347
METRIC RANK
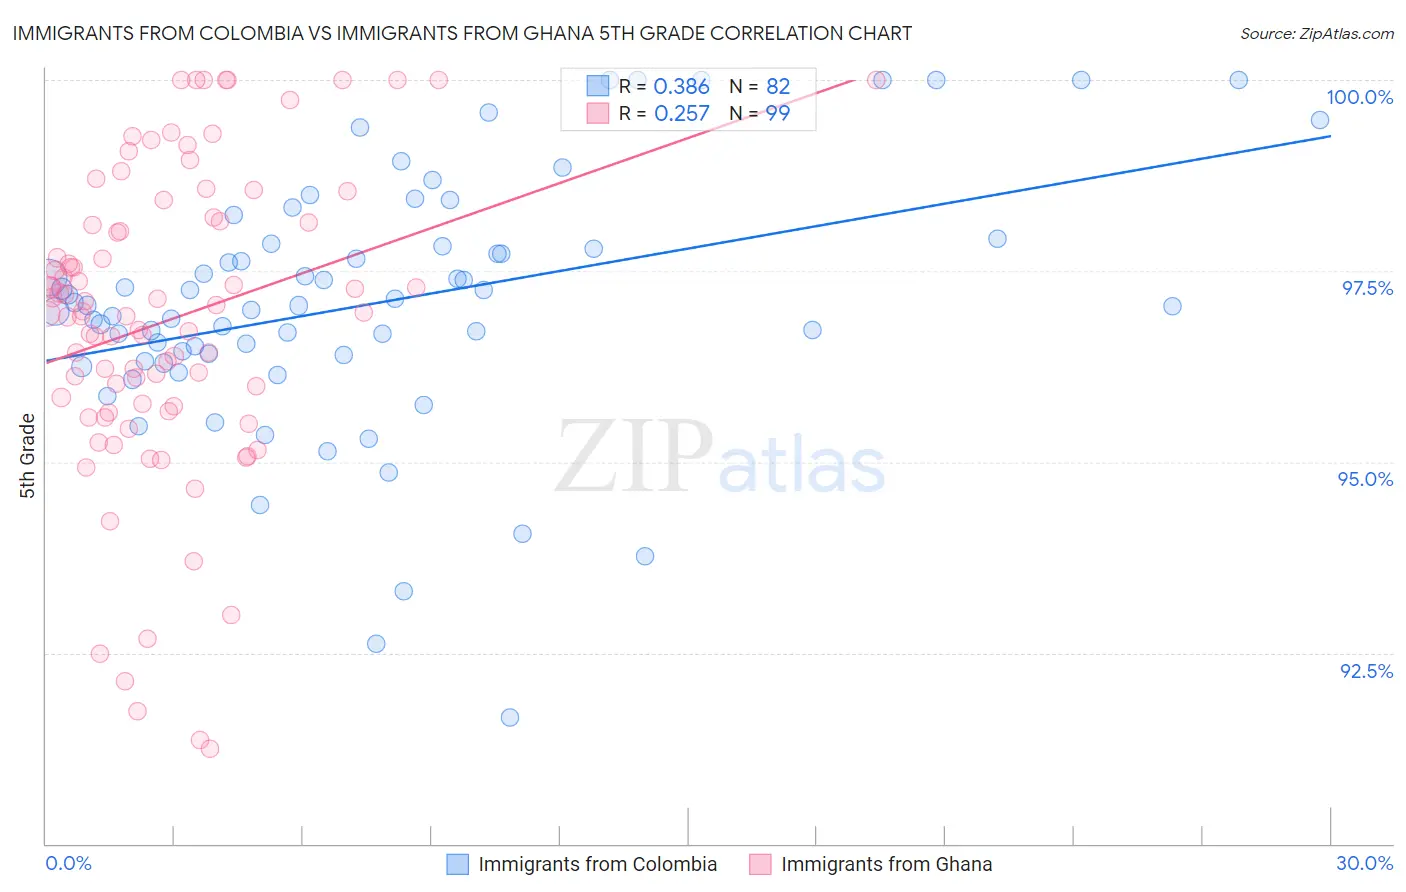
Immigrants from Colombia vs Immigrants from Ghana 5th Grade Correlation Chart
The statistical analysis conducted on geographies consisting of 378,643,693 people shows a mild positive correlation between the proportion of Immigrants from Colombia and percentage of population with at least 5th grade education in the United States with a correlation coefficient (R) of 0.386 and weighted average of 96.8%. Similarly, the statistical analysis conducted on geographies consisting of 199,952,023 people shows a weak positive correlation between the proportion of Immigrants from Ghana and percentage of population with at least 5th grade education in the United States with a correlation coefficient (R) of 0.257 and weighted average of 96.6%, a difference of 0.13%.
5th Grade Correlation Summary
| Measurement | Immigrants from Colombia | Immigrants from Ghana |
| Minimum | 91.6% | 91.2% |
| Maximum | 100.0% | 100.0% |
| Range | 8.4% | 8.8% |
| Mean | 97.1% | 96.9% |
| Median | 97.0% | 97.0% |
| Interquartile 25% (IQ1) | 96.4% | 95.7% |
| Interquartile 75% (IQ3) | 97.8% | 98.1% |
| Interquartile Range (IQR) | 1.4% | 2.4% |
| Standard Deviation (Sample) | 1.7% | 2.0% |
| Standard Deviation (Population) | 1.6% | 2.0% |
Demographics Similar to Immigrants from Colombia and Immigrants from Ghana by 5th Grade
In terms of 5th grade, the demographic groups most similar to Immigrants from Colombia are Immigrants from Jamaica (96.8%, a difference of 0.0%), Immigrants from Sierra Leone (96.8%, a difference of 0.0%), Immigrants from Uzbekistan (96.8%, a difference of 0.010%), West Indian (96.8%, a difference of 0.010%), and Taiwanese (96.7%, a difference of 0.020%). Similarly, the demographic groups most similar to Immigrants from Ghana are Immigrants from Peru (96.6%, a difference of 0.010%), Cuban (96.6%, a difference of 0.010%), Immigrants from Bolivia (96.6%, a difference of 0.010%), Immigrants from Philippines (96.6%, a difference of 0.010%), and Yaqui (96.7%, a difference of 0.020%).
| Demographics | Rating | Rank | 5th Grade |
| Immigrants | Jamaica | 0.4 /100 | #260 | Tragic 96.8% |
| Immigrants | Sierra Leone | 0.4 /100 | #261 | Tragic 96.8% |
| Immigrants | Colombia | 0.4 /100 | #262 | Tragic 96.8% |
| Immigrants | Uzbekistan | 0.3 /100 | #263 | Tragic 96.8% |
| West Indians | 0.3 /100 | #264 | Tragic 96.8% |
| Taiwanese | 0.3 /100 | #265 | Tragic 96.7% |
| Immigrants | Nigeria | 0.3 /100 | #266 | Tragic 96.7% |
| Immigrants | South America | 0.3 /100 | #267 | Tragic 96.7% |
| Armenians | 0.3 /100 | #268 | Tragic 96.7% |
| Ghanaians | 0.2 /100 | #269 | Tragic 96.7% |
| Afghans | 0.2 /100 | #270 | Tragic 96.7% |
| Immigrants | Hong Kong | 0.2 /100 | #271 | Tragic 96.7% |
| Trinidadians and Tobagonians | 0.1 /100 | #272 | Tragic 96.7% |
| Yaqui | 0.1 /100 | #273 | Tragic 96.7% |
| Immigrants | Cameroon | 0.1 /100 | #274 | Tragic 96.7% |
| Immigrants | Peru | 0.1 /100 | #275 | Tragic 96.6% |
| Cubans | 0.1 /100 | #276 | Tragic 96.6% |
| Immigrants | Bolivia | 0.1 /100 | #277 | Tragic 96.6% |
| Immigrants | Ghana | 0.1 /100 | #278 | Tragic 96.6% |
| Immigrants | Philippines | 0.1 /100 | #279 | Tragic 96.6% |
| Immigrants | Western Africa | 0.1 /100 | #280 | Tragic 96.6% |