Immigrants from Colombia vs Immigrants from Cambodia 7th Grade
COMPARE
Immigrants from Colombia
Immigrants from Cambodia
7th Grade
7th Grade Comparison
Immigrants from Colombia
Immigrants from Cambodia
95.1%
7TH GRADE
0.2/ 100
METRIC RATING
275th/ 347
METRIC RANK
93.7%
7TH GRADE
0.0/ 100
METRIC RATING
319th/ 347
METRIC RANK
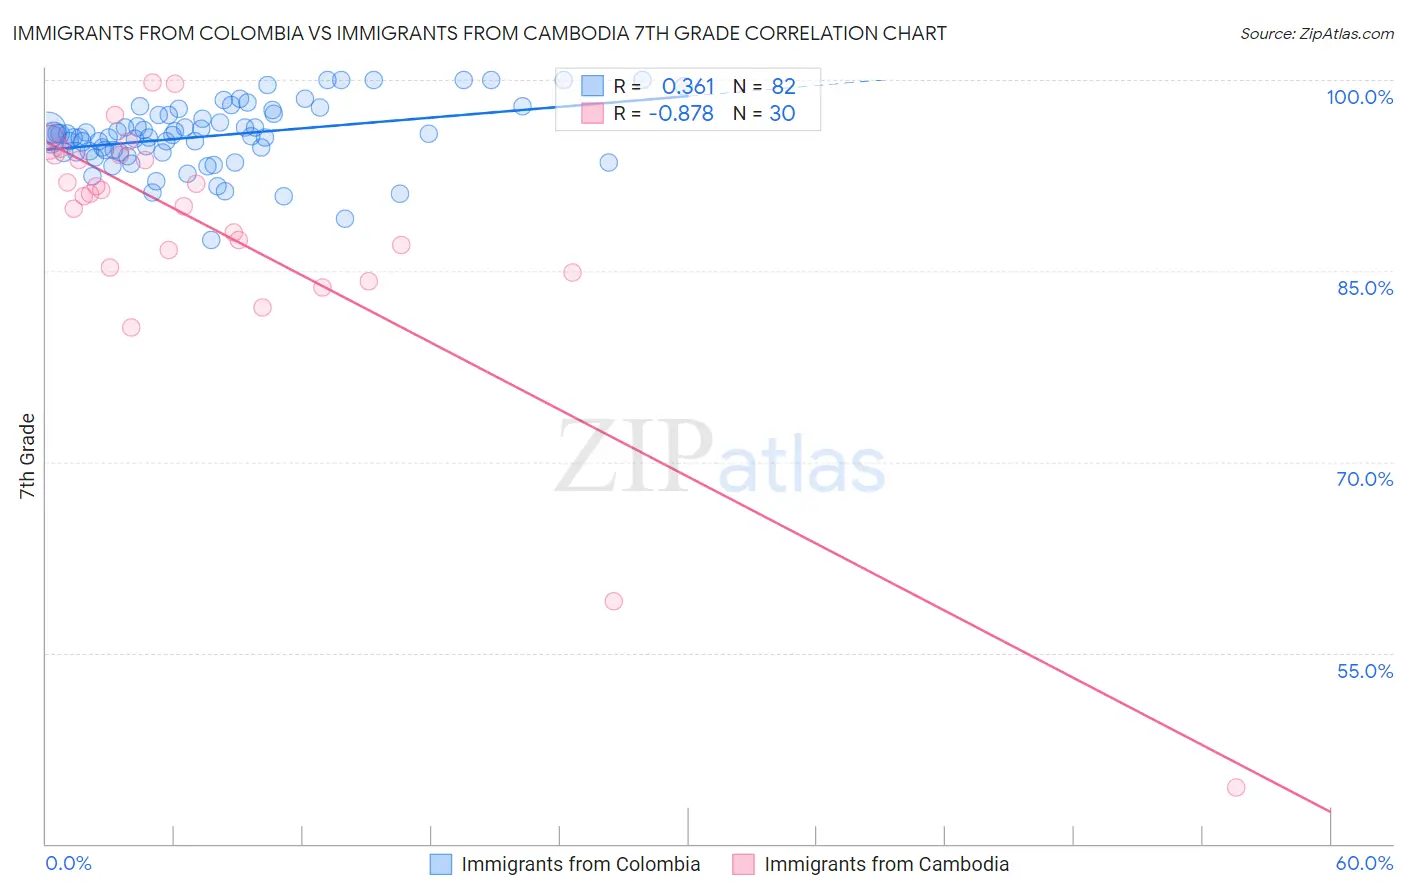
Immigrants from Colombia vs Immigrants from Cambodia 7th Grade Correlation Chart
The statistical analysis conducted on geographies consisting of 378,598,469 people shows a mild positive correlation between the proportion of Immigrants from Colombia and percentage of population with at least 7th grade education in the United States with a correlation coefficient (R) of 0.361 and weighted average of 95.1%. Similarly, the statistical analysis conducted on geographies consisting of 205,153,442 people shows a very strong negative correlation between the proportion of Immigrants from Cambodia and percentage of population with at least 7th grade education in the United States with a correlation coefficient (R) of -0.878 and weighted average of 93.7%, a difference of 1.5%.
7th Grade Correlation Summary
| Measurement | Immigrants from Colombia | Immigrants from Cambodia |
| Minimum | 87.4% | 44.4% |
| Maximum | 100.0% | 99.8% |
| Range | 12.6% | 55.4% |
| Mean | 95.6% | 88.0% |
| Median | 95.6% | 90.9% |
| Interquartile 25% (IQ1) | 94.3% | 85.3% |
| Interquartile 75% (IQ3) | 97.3% | 94.1% |
| Interquartile Range (IQR) | 2.9% | 8.8% |
| Standard Deviation (Sample) | 2.6% | 11.2% |
| Standard Deviation (Population) | 2.5% | 11.0% |
Similar Demographics by 7th Grade
Demographics Similar to Immigrants from Colombia by 7th Grade
In terms of 7th grade, the demographic groups most similar to Immigrants from Colombia are Peruvian (95.1%, a difference of 0.010%), Immigrants from Uzbekistan (95.1%, a difference of 0.010%), Immigrants from Western Africa (95.1%, a difference of 0.010%), Houma (95.1%, a difference of 0.020%), and Immigrants from South America (95.1%, a difference of 0.020%).
| Demographics | Rating | Rank | 7th Grade |
| Immigrants | Hong Kong | 0.3 /100 | #268 | Tragic 95.2% |
| Trinidadians and Tobagonians | 0.3 /100 | #269 | Tragic 95.2% |
| Houma | 0.2 /100 | #270 | Tragic 95.1% |
| Immigrants | South America | 0.2 /100 | #271 | Tragic 95.1% |
| Peruvians | 0.2 /100 | #272 | Tragic 95.1% |
| Immigrants | Uzbekistan | 0.2 /100 | #273 | Tragic 95.1% |
| Immigrants | Western Africa | 0.2 /100 | #274 | Tragic 95.1% |
| Immigrants | Colombia | 0.2 /100 | #275 | Tragic 95.1% |
| Immigrants | Thailand | 0.2 /100 | #276 | Tragic 95.1% |
| Immigrants | Afghanistan | 0.2 /100 | #277 | Tragic 95.1% |
| Immigrants | Trinidad and Tobago | 0.1 /100 | #278 | Tragic 95.1% |
| Barbadians | 0.1 /100 | #279 | Tragic 95.1% |
| Immigrants | St. Vincent and the Grenadines | 0.1 /100 | #280 | Tragic 95.0% |
| Tohono O'odham | 0.1 /100 | #281 | Tragic 95.0% |
| Immigrants | Bolivia | 0.1 /100 | #282 | Tragic 95.0% |
Demographics Similar to Immigrants from Cambodia by 7th Grade
In terms of 7th grade, the demographic groups most similar to Immigrants from Cambodia are Immigrants from Ecuador (93.7%, a difference of 0.030%), Immigrants from Cuba (93.8%, a difference of 0.11%), Immigrants from Fiji (93.5%, a difference of 0.17%), Immigrants from Vietnam (93.9%, a difference of 0.20%), and Belizean (93.5%, a difference of 0.21%).
| Demographics | Rating | Rank | 7th Grade |
| Immigrants | Immigrants | 0.0 /100 | #312 | Tragic 94.0% |
| Immigrants | Bangladesh | 0.0 /100 | #313 | Tragic 94.0% |
| Japanese | 0.0 /100 | #314 | Tragic 94.0% |
| Vietnamese | 0.0 /100 | #315 | Tragic 93.9% |
| Immigrants | Vietnam | 0.0 /100 | #316 | Tragic 93.9% |
| Immigrants | Cuba | 0.0 /100 | #317 | Tragic 93.8% |
| Immigrants | Ecuador | 0.0 /100 | #318 | Tragic 93.7% |
| Immigrants | Cambodia | 0.0 /100 | #319 | Tragic 93.7% |
| Immigrants | Fiji | 0.0 /100 | #320 | Tragic 93.5% |
| Belizeans | 0.0 /100 | #321 | Tragic 93.5% |
| Nicaraguans | 0.0 /100 | #322 | Tragic 93.5% |
| Immigrants | Belize | 0.0 /100 | #323 | Tragic 93.4% |
| Dominicans | 0.0 /100 | #324 | Tragic 93.3% |
| Central American Indians | 0.0 /100 | #325 | Tragic 93.3% |
| Nepalese | 0.0 /100 | #326 | Tragic 93.2% |