Immigrants from Colombia vs Hopi Bachelor's Degree
COMPARE
Immigrants from Colombia
Hopi
Bachelor's Degree
Bachelor's Degree Comparison
Immigrants from Colombia
Hopi
37.7%
BACHELOR'S DEGREE
45.4/ 100
METRIC RATING
179th/ 347
METRIC RANK
25.3%
BACHELOR'S DEGREE
0.0/ 100
METRIC RATING
339th/ 347
METRIC RANK
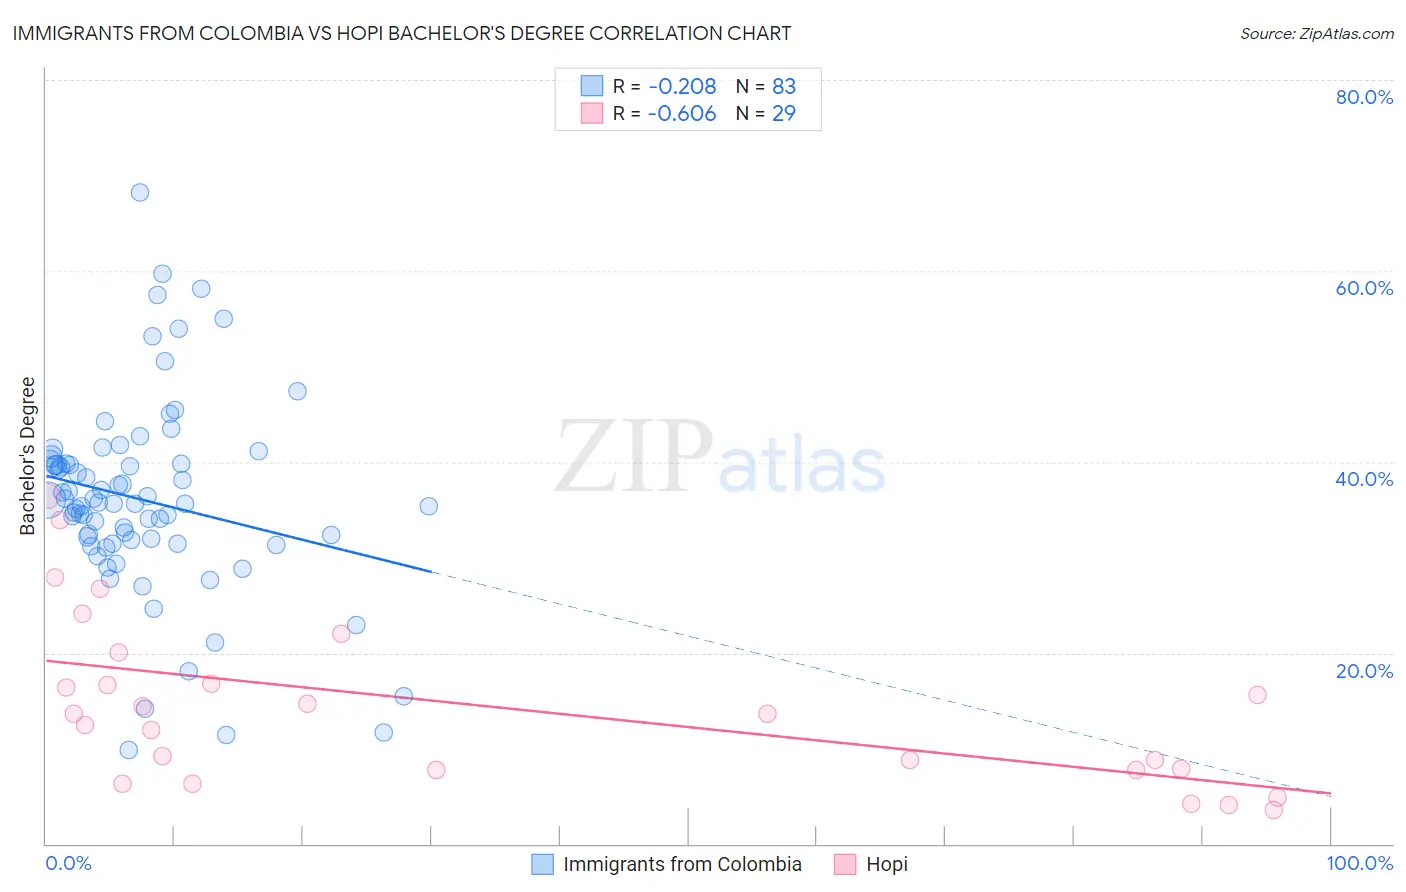
Immigrants from Colombia vs Hopi Bachelor's Degree Correlation Chart
The statistical analysis conducted on geographies consisting of 378,673,496 people shows a weak negative correlation between the proportion of Immigrants from Colombia and percentage of population with at least bachelor's degree education in the United States with a correlation coefficient (R) of -0.208 and weighted average of 37.7%. Similarly, the statistical analysis conducted on geographies consisting of 74,738,179 people shows a significant negative correlation between the proportion of Hopi and percentage of population with at least bachelor's degree education in the United States with a correlation coefficient (R) of -0.606 and weighted average of 25.3%, a difference of 48.8%.
Bachelor's Degree Correlation Summary
| Measurement | Immigrants from Colombia | Hopi |
| Minimum | 9.8% | 3.5% |
| Maximum | 68.2% | 36.4% |
| Range | 58.4% | 32.9% |
| Mean | 36.0% | 14.4% |
| Median | 35.7% | 13.6% |
| Interquartile 25% (IQ1) | 31.5% | 7.7% |
| Interquartile 75% (IQ3) | 39.8% | 18.4% |
| Interquartile Range (IQR) | 8.3% | 10.7% |
| Standard Deviation (Sample) | 10.3% | 8.8% |
| Standard Deviation (Population) | 10.3% | 8.7% |
Similar Demographics by Bachelor's Degree
Demographics Similar to Immigrants from Colombia by Bachelor's Degree
In terms of bachelor's degree, the demographic groups most similar to Immigrants from Colombia are Irish (37.6%, a difference of 0.11%), Immigrants from Cameroon (37.7%, a difference of 0.13%), Immigrants from Senegal (37.6%, a difference of 0.16%), Basque (37.7%, a difference of 0.19%), and Immigrants from Bosnia and Herzegovina (37.6%, a difference of 0.20%).
| Demographics | Rating | Rank | Bachelor's Degree |
| Immigrants | Somalia | 52.8 /100 | #172 | Average 37.9% |
| Immigrants | Iraq | 52.5 /100 | #173 | Average 37.9% |
| Immigrants | Bangladesh | 50.0 /100 | #174 | Average 37.8% |
| Immigrants | Uruguay | 48.3 /100 | #175 | Average 37.8% |
| Costa Ricans | 47.6 /100 | #176 | Average 37.7% |
| Basques | 47.4 /100 | #177 | Average 37.7% |
| Immigrants | Cameroon | 46.8 /100 | #178 | Average 37.7% |
| Immigrants | Colombia | 45.4 /100 | #179 | Average 37.7% |
| Irish | 44.3 /100 | #180 | Average 37.6% |
| Immigrants | Senegal | 43.8 /100 | #181 | Average 37.6% |
| Immigrants | Bosnia and Herzegovina | 43.4 /100 | #182 | Average 37.6% |
| Senegalese | 42.2 /100 | #183 | Average 37.5% |
| Scandinavians | 41.7 /100 | #184 | Average 37.5% |
| Immigrants | Peru | 41.3 /100 | #185 | Average 37.5% |
| Norwegians | 40.4 /100 | #186 | Average 37.5% |
Demographics Similar to Hopi by Bachelor's Degree
In terms of bachelor's degree, the demographic groups most similar to Hopi are Pueblo (25.5%, a difference of 0.93%), Inupiat (25.8%, a difference of 2.0%), Lumbee (24.8%, a difference of 2.2%), Yuman (24.5%, a difference of 3.1%), and Immigrants from Mexico (26.1%, a difference of 3.3%).
| Demographics | Rating | Rank | Bachelor's Degree |
| Menominee | 0.0 /100 | #332 | Tragic 27.3% |
| Mexicans | 0.0 /100 | #333 | Tragic 27.1% |
| Arapaho | 0.0 /100 | #334 | Tragic 26.6% |
| Natives/Alaskans | 0.0 /100 | #335 | Tragic 26.3% |
| Immigrants | Mexico | 0.0 /100 | #336 | Tragic 26.1% |
| Inupiat | 0.0 /100 | #337 | Tragic 25.8% |
| Pueblo | 0.0 /100 | #338 | Tragic 25.5% |
| Hopi | 0.0 /100 | #339 | Tragic 25.3% |
| Lumbee | 0.0 /100 | #340 | Tragic 24.8% |
| Yuman | 0.0 /100 | #341 | Tragic 24.5% |
| Yakama | 0.0 /100 | #342 | Tragic 24.5% |
| Tohono O'odham | 0.0 /100 | #343 | Tragic 24.4% |
| Navajo | 0.0 /100 | #344 | Tragic 23.6% |
| Pima | 0.0 /100 | #345 | Tragic 23.2% |
| Houma | 0.0 /100 | #346 | Tragic 21.4% |