Immigrants from Chile vs Potawatomi No Schooling Completed
COMPARE
Immigrants from Chile
Potawatomi
No Schooling Completed
No Schooling Completed Comparison
Immigrants from Chile
Potawatomi
2.2%
NO SCHOOLING COMPLETED
22.7/ 100
METRIC RATING
198th/ 347
METRIC RANK
1.7%
NO SCHOOLING COMPLETED
99.3/ 100
METRIC RATING
83rd/ 347
METRIC RANK
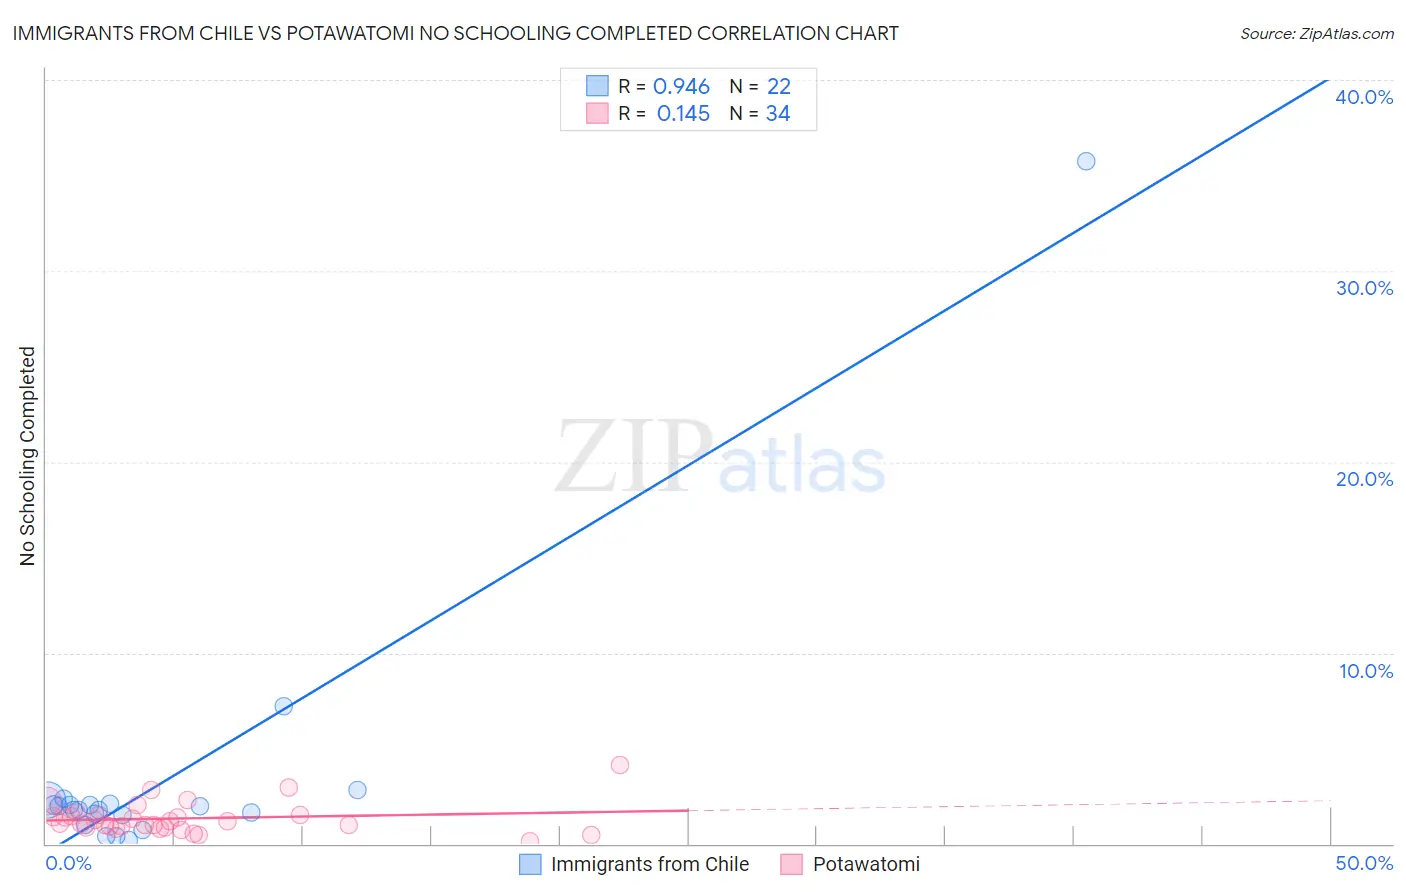
Immigrants from Chile vs Potawatomi No Schooling Completed Correlation Chart
The statistical analysis conducted on geographies consisting of 217,752,126 people shows a near-perfect positive correlation between the proportion of Immigrants from Chile and percentage of population with no schooling in the United States with a correlation coefficient (R) of 0.946 and weighted average of 2.2%. Similarly, the statistical analysis conducted on geographies consisting of 117,110,177 people shows a poor positive correlation between the proportion of Potawatomi and percentage of population with no schooling in the United States with a correlation coefficient (R) of 0.145 and weighted average of 1.7%, a difference of 24.5%.
No Schooling Completed Correlation Summary
| Measurement | Immigrants from Chile | Potawatomi |
| Minimum | 0.21% | 0.12% |
| Maximum | 35.7% | 4.1% |
| Range | 35.5% | 4.0% |
| Mean | 3.4% | 1.3% |
| Median | 1.9% | 1.1% |
| Interquartile 25% (IQ1) | 1.5% | 0.88% |
| Interquartile 75% (IQ3) | 2.1% | 1.5% |
| Interquartile Range (IQR) | 0.53% | 0.65% |
| Standard Deviation (Sample) | 7.3% | 0.80% |
| Standard Deviation (Population) | 7.2% | 0.79% |
Similar Demographics by No Schooling Completed
Demographics Similar to Immigrants from Chile by No Schooling Completed
In terms of no schooling completed, the demographic groups most similar to Immigrants from Chile are African (2.2%, a difference of 0.17%), Immigrants from Southern Europe (2.2%, a difference of 0.18%), Immigrants from Ukraine (2.2%, a difference of 0.60%), Immigrants from Northern Africa (2.2%, a difference of 0.64%), and Hawaiian (2.2%, a difference of 0.75%).
| Demographics | Rating | Rank | No Schooling Completed |
| Bermudans | 30.7 /100 | #191 | Fair 2.1% |
| Guamanians/Chamorros | 29.8 /100 | #192 | Fair 2.2% |
| Paraguayans | 29.3 /100 | #193 | Fair 2.2% |
| Immigrants | Albania | 28.3 /100 | #194 | Fair 2.2% |
| Hawaiians | 27.0 /100 | #195 | Fair 2.2% |
| Immigrants | Ukraine | 26.1 /100 | #196 | Fair 2.2% |
| Immigrants | Southern Europe | 23.8 /100 | #197 | Fair 2.2% |
| Immigrants | Chile | 22.7 /100 | #198 | Fair 2.2% |
| Africans | 21.8 /100 | #199 | Fair 2.2% |
| Immigrants | Northern Africa | 19.5 /100 | #200 | Poor 2.2% |
| Costa Ricans | 17.1 /100 | #201 | Poor 2.2% |
| Moroccans | 13.7 /100 | #202 | Poor 2.2% |
| Laotians | 13.3 /100 | #203 | Poor 2.2% |
| Hopi | 12.9 /100 | #204 | Poor 2.2% |
| Immigrants | Bahamas | 11.6 /100 | #205 | Poor 2.2% |
Demographics Similar to Potawatomi by No Schooling Completed
In terms of no schooling completed, the demographic groups most similar to Potawatomi are Immigrants from Denmark (1.7%, a difference of 0.050%), Immigrants from Australia (1.7%, a difference of 0.090%), Immigrants from South Africa (1.7%, a difference of 0.11%), Ukrainian (1.8%, a difference of 0.14%), and Icelander (1.7%, a difference of 0.20%).
| Demographics | Rating | Rank | No Schooling Completed |
| Cherokee | 99.3 /100 | #76 | Exceptional 1.7% |
| Immigrants | Sweden | 99.3 /100 | #77 | Exceptional 1.7% |
| Delaware | 99.3 /100 | #78 | Exceptional 1.7% |
| Macedonians | 99.3 /100 | #79 | Exceptional 1.7% |
| Cypriots | 99.3 /100 | #80 | Exceptional 1.7% |
| Icelanders | 99.3 /100 | #81 | Exceptional 1.7% |
| Immigrants | South Africa | 99.3 /100 | #82 | Exceptional 1.7% |
| Potawatomi | 99.3 /100 | #83 | Exceptional 1.7% |
| Immigrants | Denmark | 99.2 /100 | #84 | Exceptional 1.7% |
| Immigrants | Australia | 99.2 /100 | #85 | Exceptional 1.7% |
| Ukrainians | 99.2 /100 | #86 | Exceptional 1.8% |
| Osage | 99.2 /100 | #87 | Exceptional 1.8% |
| Immigrants | Western Europe | 99.2 /100 | #88 | Exceptional 1.8% |
| South Africans | 99.1 /100 | #89 | Exceptional 1.8% |
| Sioux | 99.0 /100 | #90 | Exceptional 1.8% |