Immigrants from Chile vs Malaysian 3rd Grade
COMPARE
Immigrants from Chile
Malaysian
3rd Grade
3rd Grade Comparison
Immigrants from Chile
Malaysians
97.6%
3RD GRADE
16.5/ 100
METRIC RATING
204th/ 347
METRIC RANK
97.0%
3RD GRADE
0.0/ 100
METRIC RATING
294th/ 347
METRIC RANK
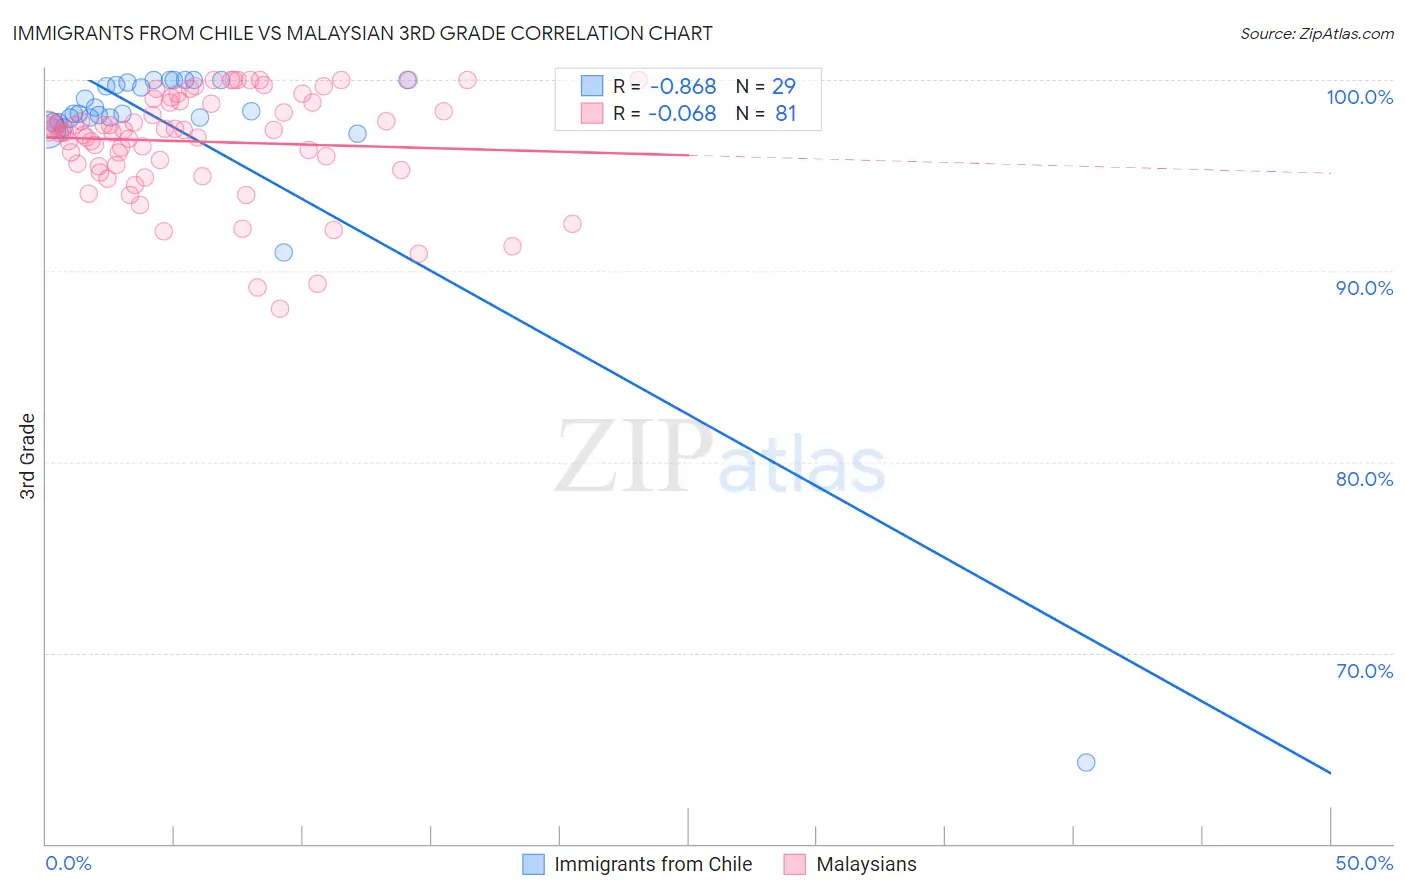
Immigrants from Chile vs Malaysian 3rd Grade Correlation Chart
The statistical analysis conducted on geographies consisting of 218,647,266 people shows a very strong negative correlation between the proportion of Immigrants from Chile and percentage of population with at least 3rd grade education in the United States with a correlation coefficient (R) of -0.868 and weighted average of 97.6%. Similarly, the statistical analysis conducted on geographies consisting of 226,107,000 people shows a slight negative correlation between the proportion of Malaysians and percentage of population with at least 3rd grade education in the United States with a correlation coefficient (R) of -0.068 and weighted average of 97.0%, a difference of 0.66%.
3rd Grade Correlation Summary
| Measurement | Immigrants from Chile | Malaysian |
| Minimum | 64.3% | 88.0% |
| Maximum | 100.0% | 100.0% |
| Range | 35.7% | 12.0% |
| Mean | 97.3% | 96.8% |
| Median | 98.2% | 97.4% |
| Interquartile 25% (IQ1) | 97.9% | 95.5% |
| Interquartile 75% (IQ3) | 99.9% | 98.9% |
| Interquartile Range (IQR) | 2.0% | 3.3% |
| Standard Deviation (Sample) | 6.6% | 2.7% |
| Standard Deviation (Population) | 6.5% | 2.7% |
Similar Demographics by 3rd Grade
Demographics Similar to Immigrants from Chile by 3rd Grade
In terms of 3rd grade, the demographic groups most similar to Immigrants from Chile are Paiute (97.6%, a difference of 0.0%), Immigrants from Southern Europe (97.6%, a difference of 0.010%), African (97.6%, a difference of 0.010%), Immigrants from Northern Africa (97.6%, a difference of 0.020%), and Immigrants from Ukraine (97.7%, a difference of 0.030%).
| Demographics | Rating | Rank | 3rd Grade |
| Hawaiians | 25.7 /100 | #197 | Fair 97.7% |
| Guamanians/Chamorros | 23.6 /100 | #198 | Fair 97.7% |
| Immigrants | Ukraine | 22.7 /100 | #199 | Fair 97.7% |
| Immigrants | Albania | 22.6 /100 | #200 | Fair 97.7% |
| Immigrants | Lebanon | 21.7 /100 | #201 | Fair 97.7% |
| Immigrants | Southern Europe | 17.7 /100 | #202 | Poor 97.6% |
| Paiute | 16.7 /100 | #203 | Poor 97.6% |
| Immigrants | Chile | 16.5 /100 | #204 | Poor 97.6% |
| Africans | 14.5 /100 | #205 | Poor 97.6% |
| Immigrants | Northern Africa | 13.0 /100 | #206 | Poor 97.6% |
| Tohono O'odham | 12.5 /100 | #207 | Poor 97.6% |
| Immigrants | Zaire | 11.9 /100 | #208 | Poor 97.6% |
| Costa Ricans | 9.6 /100 | #209 | Tragic 97.6% |
| Immigrants | Oceania | 9.5 /100 | #210 | Tragic 97.6% |
| Laotians | 9.4 /100 | #211 | Tragic 97.6% |
Demographics Similar to Malaysians by 3rd Grade
In terms of 3rd grade, the demographic groups most similar to Malaysians are Immigrants from Grenada (97.0%, a difference of 0.010%), Immigrants from Eritrea (97.0%, a difference of 0.010%), British West Indian (97.0%, a difference of 0.040%), Immigrants from Portugal (97.0%, a difference of 0.050%), and Immigrants from Afghanistan (97.0%, a difference of 0.050%).
| Demographics | Rating | Rank | 3rd Grade |
| Immigrants | St. Vincent and the Grenadines | 0.0 /100 | #287 | Tragic 97.1% |
| Immigrants | West Indies | 0.0 /100 | #288 | Tragic 97.1% |
| Immigrants | Thailand | 0.0 /100 | #289 | Tragic 97.1% |
| Immigrants | Portugal | 0.0 /100 | #290 | Tragic 97.0% |
| Immigrants | Afghanistan | 0.0 /100 | #291 | Tragic 97.0% |
| British West Indians | 0.0 /100 | #292 | Tragic 97.0% |
| Immigrants | Grenada | 0.0 /100 | #293 | Tragic 97.0% |
| Malaysians | 0.0 /100 | #294 | Tragic 97.0% |
| Immigrants | Eritrea | 0.0 /100 | #295 | Tragic 97.0% |
| Immigrants | Immigrants | 0.0 /100 | #296 | Tragic 96.9% |
| Haitians | 0.0 /100 | #297 | Tragic 96.9% |
| Immigrants | Dominica | 0.0 /100 | #298 | Tragic 96.9% |
| Somalis | 0.0 /100 | #299 | Tragic 96.8% |
| Immigrants | South Eastern Asia | 0.0 /100 | #300 | Tragic 96.8% |
| Immigrants | Cuba | 0.0 /100 | #301 | Tragic 96.8% |