Immigrants from Central America vs Samoan 4th Grade
COMPARE
Immigrants from Central America
Samoan
4th Grade
4th Grade Comparison
Immigrants from Central America
Samoans
95.1%
4TH GRADE
0.0/ 100
METRIC RATING
342nd/ 347
METRIC RANK
97.3%
4TH GRADE
6.8/ 100
METRIC RATING
216th/ 347
METRIC RANK
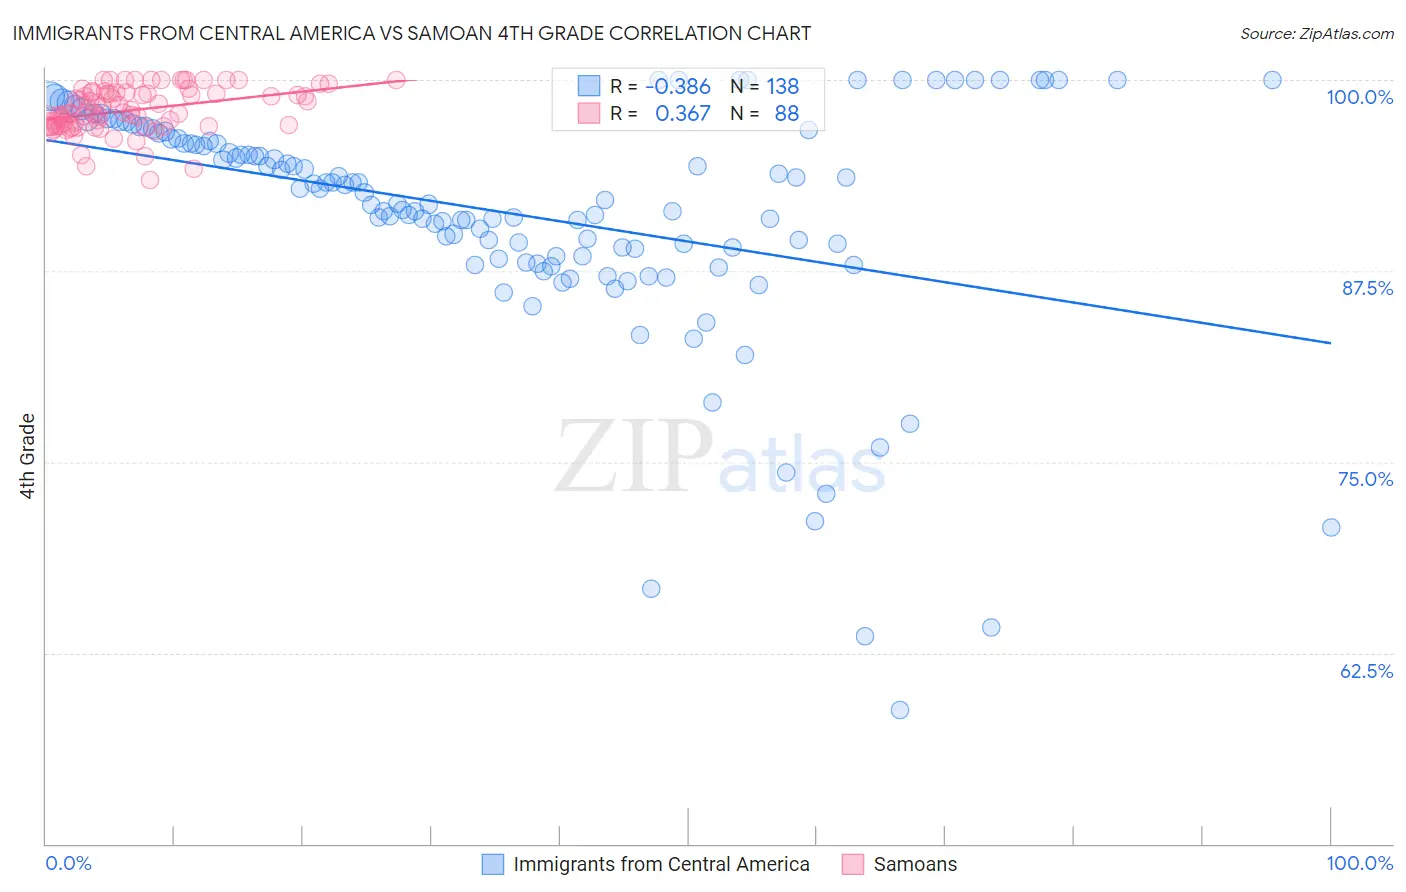
Immigrants from Central America vs Samoan 4th Grade Correlation Chart
The statistical analysis conducted on geographies consisting of 536,554,667 people shows a mild negative correlation between the proportion of Immigrants from Central America and percentage of population with at least 4th grade education in the United States with a correlation coefficient (R) of -0.386 and weighted average of 95.1%. Similarly, the statistical analysis conducted on geographies consisting of 225,205,818 people shows a mild positive correlation between the proportion of Samoans and percentage of population with at least 4th grade education in the United States with a correlation coefficient (R) of 0.367 and weighted average of 97.3%, a difference of 2.3%.
4th Grade Correlation Summary
| Measurement | Immigrants from Central America | Samoan |
| Minimum | 58.8% | 93.5% |
| Maximum | 100.0% | 100.0% |
| Range | 41.2% | 6.5% |
| Mean | 91.3% | 98.0% |
| Median | 92.8% | 97.9% |
| Interquartile 25% (IQ1) | 88.5% | 97.0% |
| Interquartile 75% (IQ3) | 96.5% | 99.1% |
| Interquartile Range (IQR) | 8.0% | 2.1% |
| Standard Deviation (Sample) | 7.7% | 1.5% |
| Standard Deviation (Population) | 7.7% | 1.5% |
Similar Demographics by 4th Grade
Demographics Similar to Immigrants from Central America by 4th Grade
In terms of 4th grade, the demographic groups most similar to Immigrants from Central America are Immigrants from Guatemala (95.1%, a difference of 0.030%), Immigrants from Mexico (95.1%, a difference of 0.060%), Salvadoran (95.0%, a difference of 0.070%), Immigrants from Yemen (95.2%, a difference of 0.080%), and Yakama (95.2%, a difference of 0.090%).
| Demographics | Rating | Rank | 4th Grade |
| Immigrants | Dominican Republic | 0.0 /100 | #333 | Tragic 95.7% |
| Immigrants | Cabo Verde | 0.0 /100 | #334 | Tragic 95.7% |
| Immigrants | Latin America | 0.0 /100 | #335 | Tragic 95.7% |
| Mexicans | 0.0 /100 | #336 | Tragic 95.6% |
| Central Americans | 0.0 /100 | #337 | Tragic 95.5% |
| Nepalese | 0.0 /100 | #338 | Tragic 95.5% |
| Guatemalans | 0.0 /100 | #339 | Tragic 95.3% |
| Yakama | 0.0 /100 | #340 | Tragic 95.2% |
| Immigrants | Yemen | 0.0 /100 | #341 | Tragic 95.2% |
| Immigrants | Central America | 0.0 /100 | #342 | Tragic 95.1% |
| Immigrants | Guatemala | 0.0 /100 | #343 | Tragic 95.1% |
| Immigrants | Mexico | 0.0 /100 | #344 | Tragic 95.1% |
| Salvadorans | 0.0 /100 | #345 | Tragic 95.0% |
| Immigrants | El Salvador | 0.0 /100 | #346 | Tragic 94.8% |
| Spanish American Indians | 0.0 /100 | #347 | Tragic 94.6% |
Demographics Similar to Samoans by 4th Grade
In terms of 4th grade, the demographic groups most similar to Samoans are Immigrants from Morocco (97.3%, a difference of 0.0%), Sierra Leonean (97.3%, a difference of 0.0%), Immigrants from Nepal (97.3%, a difference of 0.010%), Iraqi (97.3%, a difference of 0.010%), and Tohono O'odham (97.3%, a difference of 0.020%).
| Demographics | Rating | Rank | 4th Grade |
| Laotians | 9.3 /100 | #209 | Tragic 97.3% |
| Immigrants | Oceania | 9.1 /100 | #210 | Tragic 97.3% |
| Sudanese | 9.0 /100 | #211 | Tragic 97.3% |
| Tohono O'odham | 8.4 /100 | #212 | Tragic 97.3% |
| Costa Ricans | 8.3 /100 | #213 | Tragic 97.3% |
| Immigrants | Nepal | 7.7 /100 | #214 | Tragic 97.3% |
| Immigrants | Morocco | 7.1 /100 | #215 | Tragic 97.3% |
| Samoans | 6.8 /100 | #216 | Tragic 97.3% |
| Sierra Leoneans | 6.5 /100 | #217 | Tragic 97.3% |
| Iraqis | 6.3 /100 | #218 | Tragic 97.3% |
| Tongans | 5.8 /100 | #219 | Tragic 97.3% |
| South American Indians | 5.5 /100 | #220 | Tragic 97.3% |
| Immigrants | Panama | 5.4 /100 | #221 | Tragic 97.3% |
| Immigrants | Lebanon | 5.1 /100 | #222 | Tragic 97.3% |
| Immigrants | Sudan | 5.0 /100 | #223 | Tragic 97.2% |