Immigrants from Caribbean vs Thai 4th Grade
COMPARE
Immigrants from Caribbean
Thai
4th Grade
4th Grade Comparison
Immigrants from Caribbean
Thais
96.4%
4TH GRADE
0.0/ 100
METRIC RATING
305th/ 347
METRIC RANK
97.8%
4TH GRADE
96.7/ 100
METRIC RATING
110th/ 347
METRIC RANK
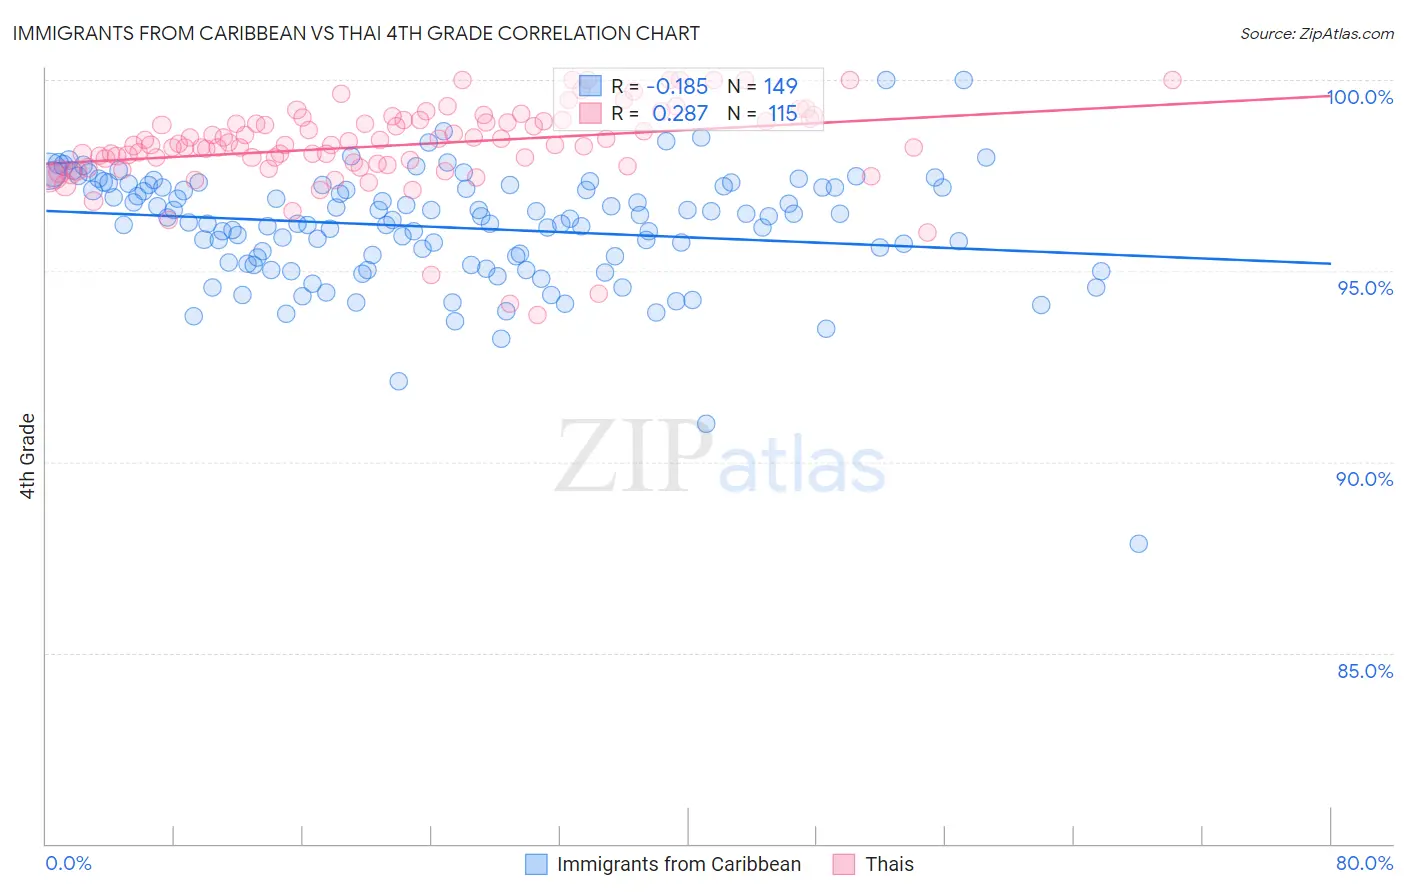
Immigrants from Caribbean vs Thai 4th Grade Correlation Chart
The statistical analysis conducted on geographies consisting of 450,065,262 people shows a poor negative correlation between the proportion of Immigrants from Caribbean and percentage of population with at least 4th grade education in the United States with a correlation coefficient (R) of -0.185 and weighted average of 96.4%. Similarly, the statistical analysis conducted on geographies consisting of 475,866,115 people shows a weak positive correlation between the proportion of Thais and percentage of population with at least 4th grade education in the United States with a correlation coefficient (R) of 0.287 and weighted average of 97.8%, a difference of 1.5%.
4th Grade Correlation Summary
| Measurement | Immigrants from Caribbean | Thai |
| Minimum | 87.9% | 93.8% |
| Maximum | 100.0% | 100.0% |
| Range | 12.1% | 6.2% |
| Mean | 96.1% | 98.3% |
| Median | 96.3% | 98.3% |
| Interquartile 25% (IQ1) | 95.2% | 97.8% |
| Interquartile 75% (IQ3) | 97.2% | 99.0% |
| Interquartile Range (IQR) | 2.0% | 1.1% |
| Standard Deviation (Sample) | 1.5% | 1.1% |
| Standard Deviation (Population) | 1.5% | 1.1% |
Similar Demographics by 4th Grade
Demographics Similar to Immigrants from Caribbean by 4th Grade
In terms of 4th grade, the demographic groups most similar to Immigrants from Caribbean are Sri Lankan (96.4%, a difference of 0.010%), Ecuadorian (96.4%, a difference of 0.020%), Guyanese (96.4%, a difference of 0.030%), Immigrants from Haiti (96.3%, a difference of 0.040%), and Immigrants from Laos (96.3%, a difference of 0.050%).
| Demographics | Rating | Rank | 4th Grade |
| Haitians | 0.0 /100 | #298 | Tragic 96.5% |
| Immigrants | Dominica | 0.0 /100 | #299 | Tragic 96.5% |
| Immigrants | South Eastern Asia | 0.0 /100 | #300 | Tragic 96.5% |
| Immigrants | Immigrants | 0.0 /100 | #301 | Tragic 96.5% |
| Immigrants | Cuba | 0.0 /100 | #302 | Tragic 96.4% |
| Guyanese | 0.0 /100 | #303 | Tragic 96.4% |
| Ecuadorians | 0.0 /100 | #304 | Tragic 96.4% |
| Immigrants | Caribbean | 0.0 /100 | #305 | Tragic 96.4% |
| Sri Lankans | 0.0 /100 | #306 | Tragic 96.4% |
| Immigrants | Haiti | 0.0 /100 | #307 | Tragic 96.3% |
| Immigrants | Laos | 0.0 /100 | #308 | Tragic 96.3% |
| Immigrants | Guyana | 0.0 /100 | #309 | Tragic 96.3% |
| Immigrants | Burma/Myanmar | 0.0 /100 | #310 | Tragic 96.3% |
| Immigrants | Bangladesh | 0.0 /100 | #311 | Tragic 96.2% |
| Cape Verdeans | 0.0 /100 | #312 | Tragic 96.2% |
Demographics Similar to Thais by 4th Grade
In terms of 4th grade, the demographic groups most similar to Thais are Immigrants from Latvia (97.8%, a difference of 0.0%), Immigrants from Switzerland (97.8%, a difference of 0.010%), Bhutanese (97.9%, a difference of 0.020%), Immigrants from Singapore (97.9%, a difference of 0.020%), and Okinawan (97.8%, a difference of 0.020%).
| Demographics | Rating | Rank | 4th Grade |
| Puget Sound Salish | 97.7 /100 | #103 | Exceptional 97.9% |
| Immigrants | Nonimmigrants | 97.5 /100 | #104 | Exceptional 97.9% |
| German Russians | 97.5 /100 | #105 | Exceptional 97.9% |
| Immigrants | Czechoslovakia | 97.5 /100 | #106 | Exceptional 97.9% |
| Bhutanese | 97.4 /100 | #107 | Exceptional 97.9% |
| Immigrants | Singapore | 97.3 /100 | #108 | Exceptional 97.9% |
| Immigrants | Latvia | 96.8 /100 | #109 | Exceptional 97.8% |
| Thais | 96.7 /100 | #110 | Exceptional 97.8% |
| Immigrants | Switzerland | 96.1 /100 | #111 | Exceptional 97.8% |
| Okinawans | 96.0 /100 | #112 | Exceptional 97.8% |
| Basques | 95.8 /100 | #113 | Exceptional 97.8% |
| Iroquois | 95.4 /100 | #114 | Exceptional 97.8% |
| Lebanese | 95.4 /100 | #115 | Exceptional 97.8% |
| Immigrants | Croatia | 95.2 /100 | #116 | Exceptional 97.8% |
| Syrians | 94.9 /100 | #117 | Exceptional 97.8% |