Immigrants from Caribbean vs South African 5th Grade
COMPARE
Immigrants from Caribbean
South African
5th Grade
5th Grade Comparison
Immigrants from Caribbean
South Africans
96.0%
5TH GRADE
0.0/ 100
METRIC RATING
307th/ 347
METRIC RANK
97.7%
5TH GRADE
98.3/ 100
METRIC RATING
101st/ 347
METRIC RANK
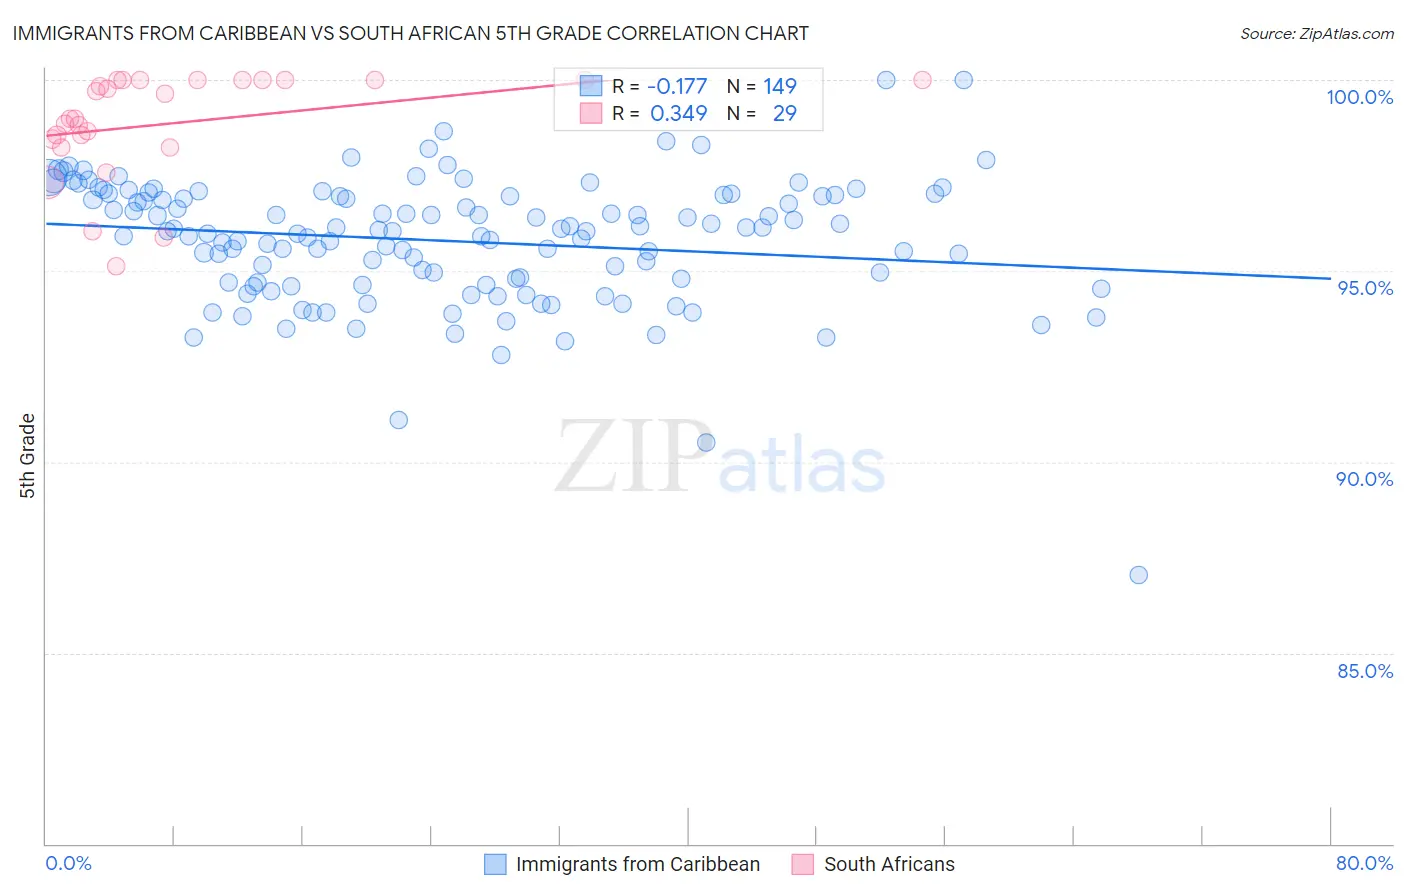
Immigrants from Caribbean vs South African 5th Grade Correlation Chart
The statistical analysis conducted on geographies consisting of 450,065,262 people shows a poor negative correlation between the proportion of Immigrants from Caribbean and percentage of population with at least 5th grade education in the United States with a correlation coefficient (R) of -0.177 and weighted average of 96.0%. Similarly, the statistical analysis conducted on geographies consisting of 182,604,532 people shows a mild positive correlation between the proportion of South Africans and percentage of population with at least 5th grade education in the United States with a correlation coefficient (R) of 0.349 and weighted average of 97.7%, a difference of 1.8%.
5th Grade Correlation Summary
| Measurement | Immigrants from Caribbean | South African |
| Minimum | 87.0% | 95.1% |
| Maximum | 100.0% | 100.0% |
| Range | 13.0% | 4.9% |
| Mean | 95.8% | 98.9% |
| Median | 96.0% | 99.0% |
| Interquartile 25% (IQ1) | 94.7% | 98.3% |
| Interquartile 75% (IQ3) | 97.0% | 100.0% |
| Interquartile Range (IQR) | 2.3% | 1.7% |
| Standard Deviation (Sample) | 1.7% | 1.4% |
| Standard Deviation (Population) | 1.7% | 1.3% |
Similar Demographics by 5th Grade
Demographics Similar to Immigrants from Caribbean by 5th Grade
In terms of 5th grade, the demographic groups most similar to Immigrants from Caribbean are Immigrants from Haiti (96.0%, a difference of 0.0%), Ecuadorian (96.0%, a difference of 0.010%), Immigrants from Laos (96.0%, a difference of 0.020%), Immigrants from Guyana (96.0%, a difference of 0.020%), and Immigrants from Burma/Myanmar (96.1%, a difference of 0.030%).
| Demographics | Rating | Rank | 5th Grade |
| Sri Lankans | 0.0 /100 | #300 | Tragic 96.1% |
| Immigrants | Cuba | 0.0 /100 | #301 | Tragic 96.1% |
| Guyanese | 0.0 /100 | #302 | Tragic 96.1% |
| Puerto Ricans | 0.0 /100 | #303 | Tragic 96.1% |
| Immigrants | Burma/Myanmar | 0.0 /100 | #304 | Tragic 96.1% |
| Immigrants | Laos | 0.0 /100 | #305 | Tragic 96.0% |
| Immigrants | Haiti | 0.0 /100 | #306 | Tragic 96.0% |
| Immigrants | Caribbean | 0.0 /100 | #307 | Tragic 96.0% |
| Ecuadorians | 0.0 /100 | #308 | Tragic 96.0% |
| Immigrants | Guyana | 0.0 /100 | #309 | Tragic 96.0% |
| Indonesians | 0.0 /100 | #310 | Tragic 96.0% |
| Immigrants | Bangladesh | 0.0 /100 | #311 | Tragic 96.0% |
| Vietnamese | 0.0 /100 | #312 | Tragic 95.9% |
| Bangladeshis | 0.0 /100 | #313 | Tragic 95.9% |
| Immigrants | Portugal | 0.0 /100 | #314 | Tragic 95.9% |
Demographics Similar to South Africans by 5th Grade
In terms of 5th grade, the demographic groups most similar to South Africans are Yugoslavian (97.7%, a difference of 0.0%), Turkish (97.7%, a difference of 0.0%), Puget Sound Salish (97.7%, a difference of 0.0%), Cree (97.7%, a difference of 0.010%), and Immigrants from Denmark (97.8%, a difference of 0.020%).
| Demographics | Rating | Rank | 5th Grade |
| Immigrants | Denmark | 98.6 /100 | #94 | Exceptional 97.8% |
| Romanians | 98.6 /100 | #95 | Exceptional 97.8% |
| Immigrants | Germany | 98.5 /100 | #96 | Exceptional 97.8% |
| Cree | 98.4 /100 | #97 | Exceptional 97.7% |
| Yugoslavians | 98.3 /100 | #98 | Exceptional 97.7% |
| Turks | 98.3 /100 | #99 | Exceptional 97.7% |
| Puget Sound Salish | 98.3 /100 | #100 | Exceptional 97.7% |
| South Africans | 98.3 /100 | #101 | Exceptional 97.7% |
| Choctaw | 98.0 /100 | #102 | Exceptional 97.7% |
| Cheyenne | 97.9 /100 | #103 | Exceptional 97.7% |
| German Russians | 97.8 /100 | #104 | Exceptional 97.7% |
| Bhutanese | 97.6 /100 | #105 | Exceptional 97.7% |
| Immigrants | Czechoslovakia | 97.5 /100 | #106 | Exceptional 97.7% |
| Immigrants | Singapore | 97.5 /100 | #107 | Exceptional 97.7% |
| Immigrants | Nonimmigrants | 97.3 /100 | #108 | Exceptional 97.7% |