Immigrants from Caribbean vs Native/Alaskan Kindergarten
COMPARE
Immigrants from Caribbean
Native/Alaskan
Kindergarten
Kindergarten Comparison
Immigrants from Caribbean
Natives/Alaskans
97.1%
KINDERGARTEN
0.0/ 100
METRIC RATING
302nd/ 347
METRIC RANK
98.0%
KINDERGARTEN
51.0/ 100
METRIC RATING
172nd/ 347
METRIC RANK
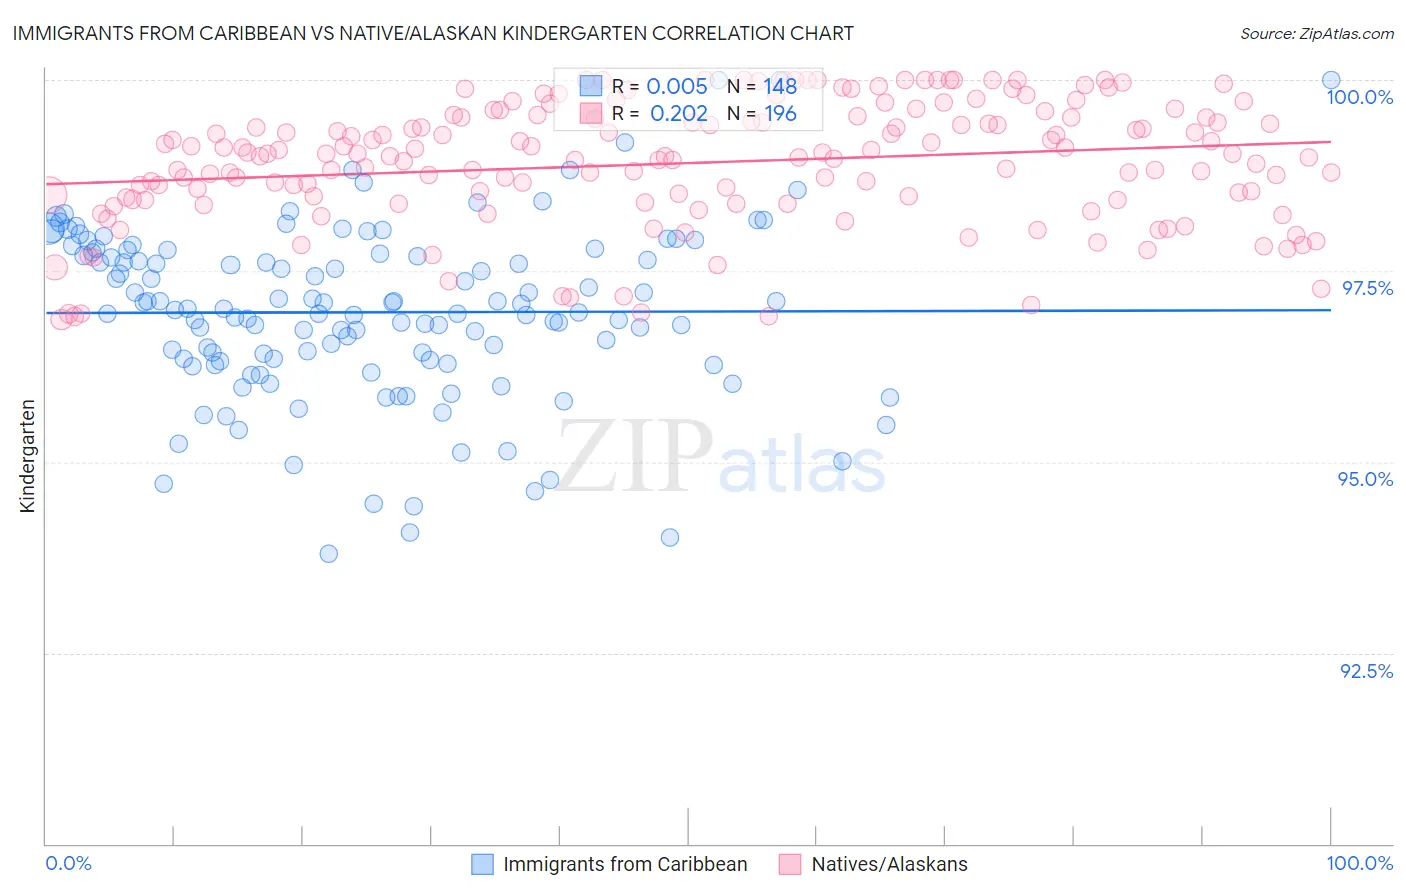
Immigrants from Caribbean vs Native/Alaskan Kindergarten Correlation Chart
The statistical analysis conducted on geographies consisting of 449,948,226 people shows no correlation between the proportion of Immigrants from Caribbean and percentage of population with at least kindergarten education in the United States with a correlation coefficient (R) of 0.005 and weighted average of 97.1%. Similarly, the statistical analysis conducted on geographies consisting of 513,036,548 people shows a weak positive correlation between the proportion of Natives/Alaskans and percentage of population with at least kindergarten education in the United States with a correlation coefficient (R) of 0.202 and weighted average of 98.0%, a difference of 0.90%.
Kindergarten Correlation Summary
| Measurement | Immigrants from Caribbean | Native/Alaskan |
| Minimum | 93.8% | 96.9% |
| Maximum | 100.0% | 100.0% |
| Range | 6.2% | 3.1% |
| Mean | 97.0% | 98.9% |
| Median | 97.0% | 99.0% |
| Interquartile 25% (IQ1) | 96.3% | 98.4% |
| Interquartile 75% (IQ3) | 97.7% | 99.5% |
| Interquartile Range (IQR) | 1.4% | 1.1% |
| Standard Deviation (Sample) | 1.1% | 0.80% |
| Standard Deviation (Population) | 1.1% | 0.79% |
Similar Demographics by Kindergarten
Demographics Similar to Immigrants from Caribbean by Kindergarten
In terms of kindergarten, the demographic groups most similar to Immigrants from Caribbean are Immigrants from South Eastern Asia (97.1%, a difference of 0.030%), Somali (97.0%, a difference of 0.040%), Nicaraguan (97.0%, a difference of 0.040%), Ecuadorian (97.0%, a difference of 0.040%), and Haitian (97.1%, a difference of 0.050%).
| Demographics | Rating | Rank | Kindergarten |
| Immigrants | Grenada | 0.0 /100 | #295 | Tragic 97.2% |
| Immigrants | Eritrea | 0.0 /100 | #296 | Tragic 97.2% |
| Central American Indians | 0.0 /100 | #297 | Tragic 97.2% |
| Immigrants | Dominica | 0.0 /100 | #298 | Tragic 97.1% |
| Immigrants | Cuba | 0.0 /100 | #299 | Tragic 97.1% |
| Haitians | 0.0 /100 | #300 | Tragic 97.1% |
| Immigrants | South Eastern Asia | 0.0 /100 | #301 | Tragic 97.1% |
| Immigrants | Caribbean | 0.0 /100 | #302 | Tragic 97.1% |
| Somalis | 0.0 /100 | #303 | Tragic 97.0% |
| Nicaraguans | 0.0 /100 | #304 | Tragic 97.0% |
| Ecuadorians | 0.0 /100 | #305 | Tragic 97.0% |
| Belizeans | 0.0 /100 | #306 | Tragic 97.0% |
| Hispanics or Latinos | 0.0 /100 | #307 | Tragic 97.0% |
| Immigrants | Somalia | 0.0 /100 | #308 | Tragic 97.0% |
| Immigrants | Haiti | 0.0 /100 | #309 | Tragic 97.0% |
Demographics Similar to Natives/Alaskans by Kindergarten
In terms of kindergarten, the demographic groups most similar to Natives/Alaskans are Kenyan (98.0%, a difference of 0.0%), Immigrants from Brazil (98.0%, a difference of 0.0%), Immigrants from Sri Lanka (97.9%, a difference of 0.0%), Immigrants from Spain (98.0%, a difference of 0.010%), and Navajo (98.0%, a difference of 0.010%).
| Demographics | Rating | Rank | Kindergarten |
| Ugandans | 56.9 /100 | #165 | Average 98.0% |
| Chileans | 56.3 /100 | #166 | Average 98.0% |
| Immigrants | Spain | 54.6 /100 | #167 | Average 98.0% |
| Navajo | 54.4 /100 | #168 | Average 98.0% |
| Immigrants | Korea | 54.1 /100 | #169 | Average 98.0% |
| Bermudans | 54.0 /100 | #170 | Average 98.0% |
| Immigrants | Jordan | 54.0 /100 | #171 | Average 98.0% |
| Natives/Alaskans | 51.0 /100 | #172 | Average 98.0% |
| Kenyans | 51.0 /100 | #173 | Average 98.0% |
| Immigrants | Brazil | 50.0 /100 | #174 | Average 98.0% |
| Immigrants | Sri Lanka | 49.6 /100 | #175 | Average 97.9% |
| Albanians | 48.5 /100 | #176 | Average 97.9% |
| Immigrants | Venezuela | 47.9 /100 | #177 | Average 97.9% |
| Brazilians | 47.6 /100 | #178 | Average 97.9% |
| Argentineans | 46.8 /100 | #179 | Average 97.9% |