Immigrants from Caribbean vs Immigrants from Southern Europe 2nd Grade
COMPARE
Immigrants from Caribbean
Immigrants from Southern Europe
2nd Grade
2nd Grade Comparison
Immigrants from Caribbean
Immigrants from Southern Europe
96.9%
2ND GRADE
0.0/ 100
METRIC RATING
304th/ 347
METRIC RANK
97.8%
2ND GRADE
18.1/ 100
METRIC RATING
205th/ 347
METRIC RANK
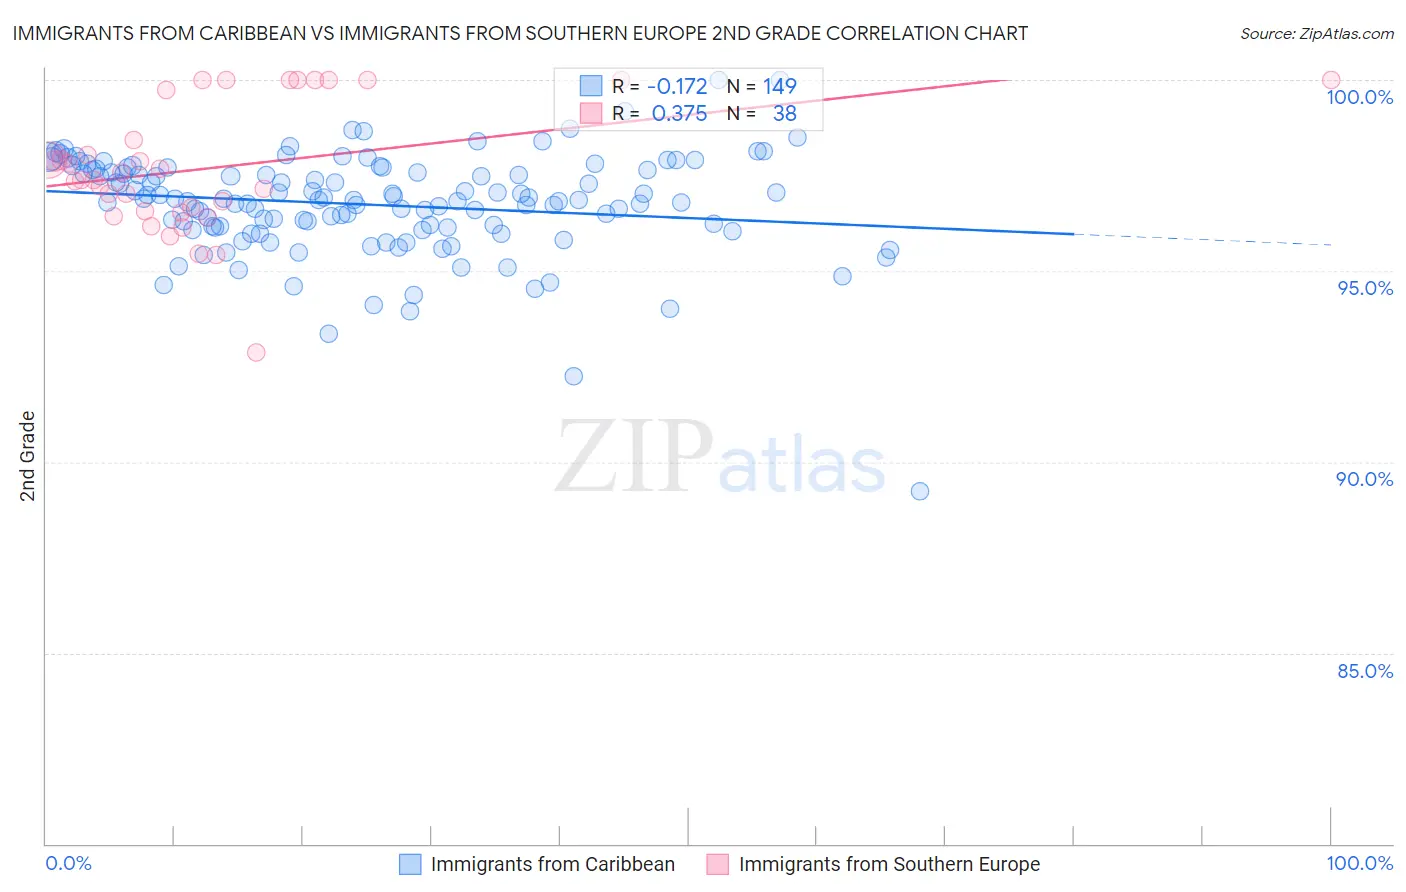
Immigrants from Caribbean vs Immigrants from Southern Europe 2nd Grade Correlation Chart
The statistical analysis conducted on geographies consisting of 450,065,262 people shows a poor negative correlation between the proportion of Immigrants from Caribbean and percentage of population with at least 2nd grade education in the United States with a correlation coefficient (R) of -0.172 and weighted average of 96.9%. Similarly, the statistical analysis conducted on geographies consisting of 402,804,595 people shows a mild positive correlation between the proportion of Immigrants from Southern Europe and percentage of population with at least 2nd grade education in the United States with a correlation coefficient (R) of 0.375 and weighted average of 97.8%, a difference of 0.87%.
2nd Grade Correlation Summary
| Measurement | Immigrants from Caribbean | Immigrants from Southern Europe |
| Minimum | 89.2% | 92.9% |
| Maximum | 100.0% | 100.0% |
| Range | 10.8% | 7.1% |
| Mean | 96.7% | 97.7% |
| Median | 96.8% | 97.5% |
| Interquartile 25% (IQ1) | 96.1% | 96.6% |
| Interquartile 75% (IQ3) | 97.6% | 99.8% |
| Interquartile Range (IQR) | 1.5% | 3.2% |
| Standard Deviation (Sample) | 1.4% | 1.7% |
| Standard Deviation (Population) | 1.3% | 1.7% |
Similar Demographics by 2nd Grade
Demographics Similar to Immigrants from Caribbean by 2nd Grade
In terms of 2nd grade, the demographic groups most similar to Immigrants from Caribbean are Ecuadorian (96.9%, a difference of 0.0%), Nicaraguan (96.9%, a difference of 0.020%), Immigrants from Somalia (96.9%, a difference of 0.040%), Somali (97.0%, a difference of 0.050%), and Central American Indian (97.0%, a difference of 0.070%).
| Demographics | Rating | Rank | 2nd Grade |
| Immigrants | Cuba | 0.0 /100 | #297 | Tragic 97.0% |
| Immigrants | Dominica | 0.0 /100 | #298 | Tragic 97.0% |
| Haitians | 0.0 /100 | #299 | Tragic 97.0% |
| Immigrants | South Eastern Asia | 0.0 /100 | #300 | Tragic 97.0% |
| Central American Indians | 0.0 /100 | #301 | Tragic 97.0% |
| Somalis | 0.0 /100 | #302 | Tragic 97.0% |
| Ecuadorians | 0.0 /100 | #303 | Tragic 96.9% |
| Immigrants | Caribbean | 0.0 /100 | #304 | Tragic 96.9% |
| Nicaraguans | 0.0 /100 | #305 | Tragic 96.9% |
| Immigrants | Somalia | 0.0 /100 | #306 | Tragic 96.9% |
| Immigrants | Azores | 0.0 /100 | #307 | Tragic 96.8% |
| Immigrants | Haiti | 0.0 /100 | #308 | Tragic 96.8% |
| Belizeans | 0.0 /100 | #309 | Tragic 96.8% |
| Sri Lankans | 0.0 /100 | #310 | Tragic 96.8% |
| Guyanese | 0.0 /100 | #311 | Tragic 96.8% |
Demographics Similar to Immigrants from Southern Europe by 2nd Grade
In terms of 2nd grade, the demographic groups most similar to Immigrants from Southern Europe are Immigrants from Albania (97.8%, a difference of 0.0%), Immigrants from Chile (97.7%, a difference of 0.0%), Immigrants from Lebanon (97.8%, a difference of 0.010%), Tohono O'odham (97.8%, a difference of 0.010%), and Immigrants from Ukraine (97.8%, a difference of 0.010%).
| Demographics | Rating | Rank | 2nd Grade |
| Guamanians/Chamorros | 25.7 /100 | #198 | Fair 97.8% |
| Immigrants | Egypt | 24.4 /100 | #199 | Fair 97.8% |
| Immigrants | Lebanon | 20.9 /100 | #200 | Fair 97.8% |
| Tohono O'odham | 20.9 /100 | #201 | Fair 97.8% |
| Immigrants | Ukraine | 20.5 /100 | #202 | Fair 97.8% |
| Yuman | 20.0 /100 | #203 | Fair 97.8% |
| Immigrants | Albania | 18.4 /100 | #204 | Poor 97.8% |
| Immigrants | Southern Europe | 18.1 /100 | #205 | Poor 97.8% |
| Immigrants | Chile | 17.3 /100 | #206 | Poor 97.7% |
| Africans | 15.6 /100 | #207 | Poor 97.7% |
| Immigrants | Northern Africa | 12.3 /100 | #208 | Poor 97.7% |
| Immigrants | Oceania | 10.9 /100 | #209 | Poor 97.7% |
| Costa Ricans | 10.5 /100 | #210 | Poor 97.7% |
| Laotians | 9.9 /100 | #211 | Tragic 97.7% |
| Immigrants | Bahamas | 8.4 /100 | #212 | Tragic 97.7% |