Immigrants from Caribbean vs Immigrants from Saudi Arabia College, 1 year or more
COMPARE
Immigrants from Caribbean
Immigrants from Saudi Arabia
College, 1 year or more
College, 1 year or more Comparison
Immigrants from Caribbean
Immigrants from Saudi Arabia
51.4%
COLLEGE, 1 YEAR OR MORE
0.0/ 100
METRIC RATING
313th/ 347
METRIC RANK
65.0%
COLLEGE, 1 YEAR OR MORE
99.9/ 100
METRIC RATING
38th/ 347
METRIC RANK
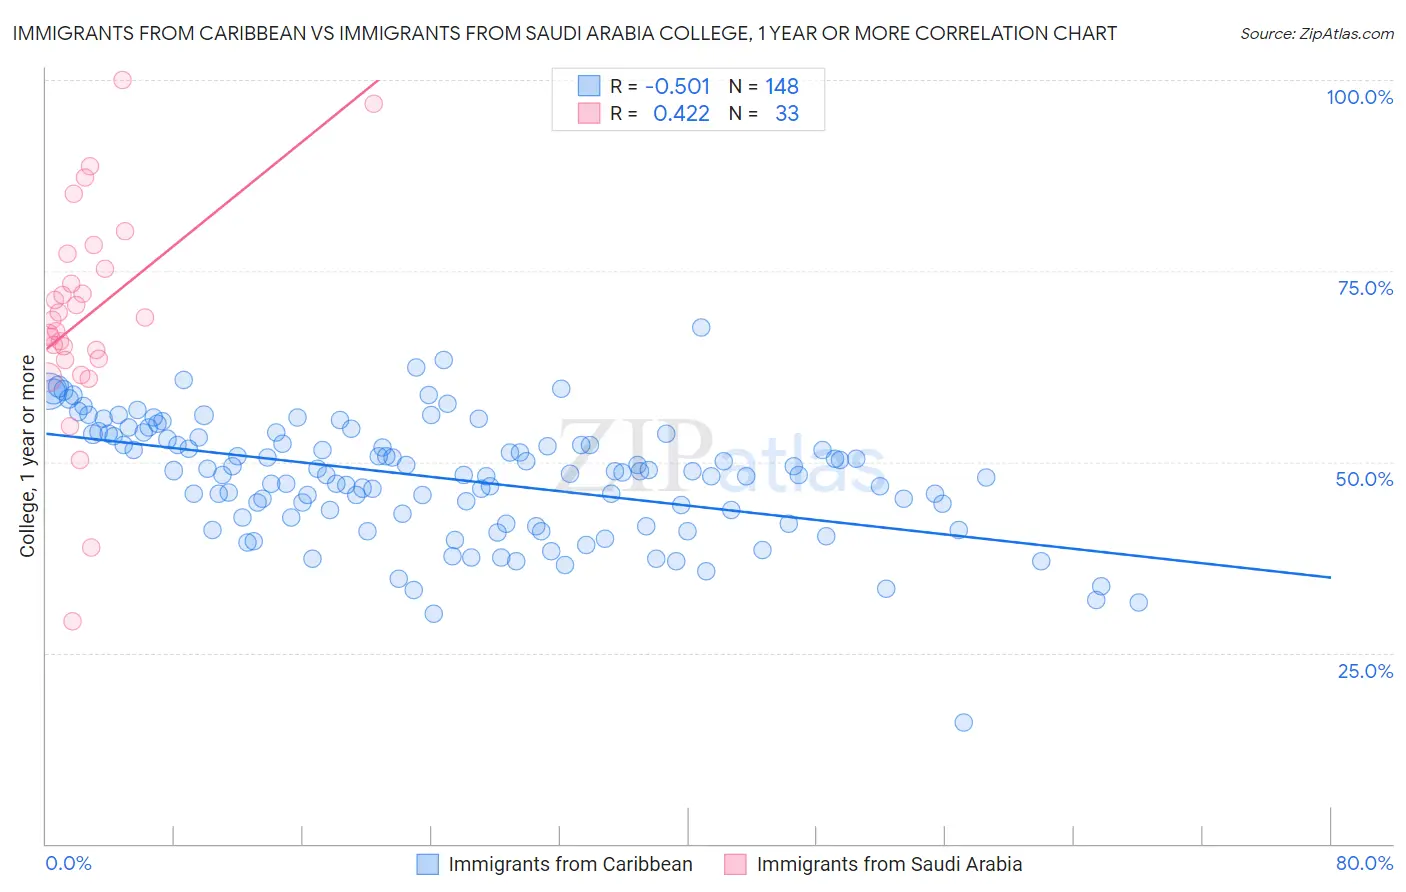
Immigrants from Caribbean vs Immigrants from Saudi Arabia College, 1 year or more Correlation Chart
The statistical analysis conducted on geographies consisting of 450,060,902 people shows a substantial negative correlation between the proportion of Immigrants from Caribbean and percentage of population with at least college, 1 year or more education in the United States with a correlation coefficient (R) of -0.501 and weighted average of 51.4%. Similarly, the statistical analysis conducted on geographies consisting of 164,289,382 people shows a moderate positive correlation between the proportion of Immigrants from Saudi Arabia and percentage of population with at least college, 1 year or more education in the United States with a correlation coefficient (R) of 0.422 and weighted average of 65.0%, a difference of 26.5%.
College, 1 year or more Correlation Summary
| Measurement | Immigrants from Caribbean | Immigrants from Saudi Arabia |
| Minimum | 15.9% | 29.1% |
| Maximum | 67.7% | 100.0% |
| Range | 51.8% | 70.9% |
| Mean | 47.8% | 69.1% |
| Median | 48.6% | 68.6% |
| Interquartile 25% (IQ1) | 42.7% | 63.3% |
| Interquartile 75% (IQ3) | 53.3% | 76.3% |
| Interquartile Range (IQR) | 10.6% | 12.9% |
| Standard Deviation (Sample) | 7.8% | 14.2% |
| Standard Deviation (Population) | 7.7% | 14.0% |
Similar Demographics by College, 1 year or more
Demographics Similar to Immigrants from Caribbean by College, 1 year or more
In terms of college, 1 year or more, the demographic groups most similar to Immigrants from Caribbean are Pueblo (51.5%, a difference of 0.13%), Immigrants from Haiti (51.5%, a difference of 0.17%), Fijian (51.3%, a difference of 0.22%), Honduran (51.6%, a difference of 0.33%), and Guatemalan (51.2%, a difference of 0.45%).
| Demographics | Rating | Rank | College, 1 year or more |
| Mexican American Indians | 0.0 /100 | #306 | Tragic 51.9% |
| Immigrants | Portugal | 0.0 /100 | #307 | Tragic 51.9% |
| Salvadorans | 0.0 /100 | #308 | Tragic 51.8% |
| Apache | 0.0 /100 | #309 | Tragic 51.8% |
| Hondurans | 0.0 /100 | #310 | Tragic 51.6% |
| Immigrants | Haiti | 0.0 /100 | #311 | Tragic 51.5% |
| Pueblo | 0.0 /100 | #312 | Tragic 51.5% |
| Immigrants | Caribbean | 0.0 /100 | #313 | Tragic 51.4% |
| Fijians | 0.0 /100 | #314 | Tragic 51.3% |
| Guatemalans | 0.0 /100 | #315 | Tragic 51.2% |
| Cajuns | 0.0 /100 | #316 | Tragic 51.2% |
| Hispanics or Latinos | 0.0 /100 | #317 | Tragic 51.1% |
| Immigrants | Honduras | 0.0 /100 | #318 | Tragic 51.0% |
| Immigrants | El Salvador | 0.0 /100 | #319 | Tragic 51.0% |
| Kiowa | 0.0 /100 | #320 | Tragic 51.0% |
Demographics Similar to Immigrants from Saudi Arabia by College, 1 year or more
In terms of college, 1 year or more, the demographic groups most similar to Immigrants from Saudi Arabia are Estonian (65.0%, a difference of 0.070%), Immigrants from Kuwait (65.0%, a difference of 0.13%), Immigrants from South Africa (65.1%, a difference of 0.15%), Russian (65.1%, a difference of 0.15%), and Immigrants from Turkey (65.2%, a difference of 0.24%).
| Demographics | Rating | Rank | College, 1 year or more |
| Turks | 100.0 /100 | #31 | Exceptional 65.5% |
| Bulgarians | 100.0 /100 | #32 | Exceptional 65.5% |
| Immigrants | Sri Lanka | 99.9 /100 | #33 | Exceptional 65.4% |
| Israelis | 99.9 /100 | #34 | Exceptional 65.3% |
| Immigrants | Turkey | 99.9 /100 | #35 | Exceptional 65.2% |
| Immigrants | South Africa | 99.9 /100 | #36 | Exceptional 65.1% |
| Russians | 99.9 /100 | #37 | Exceptional 65.1% |
| Immigrants | Saudi Arabia | 99.9 /100 | #38 | Exceptional 65.0% |
| Estonians | 99.9 /100 | #39 | Exceptional 65.0% |
| Immigrants | Kuwait | 99.9 /100 | #40 | Exceptional 65.0% |
| Mongolians | 99.9 /100 | #41 | Exceptional 64.8% |
| Immigrants | Latvia | 99.9 /100 | #42 | Exceptional 64.8% |
| Immigrants | Russia | 99.9 /100 | #43 | Exceptional 64.7% |
| Immigrants | Norway | 99.9 /100 | #44 | Exceptional 64.7% |
| Immigrants | Lithuania | 99.9 /100 | #45 | Exceptional 64.6% |