Immigrants from Canada vs Italian No Schooling Completed
COMPARE
Immigrants from Canada
Italian
No Schooling Completed
No Schooling Completed Comparison
Immigrants from Canada
Italians
1.6%
NO SCHOOLING COMPLETED
99.8/ 100
METRIC RATING
52nd/ 347
METRIC RANK
1.5%
NO SCHOOLING COMPLETED
100.0/ 100
METRIC RATING
33rd/ 347
METRIC RANK
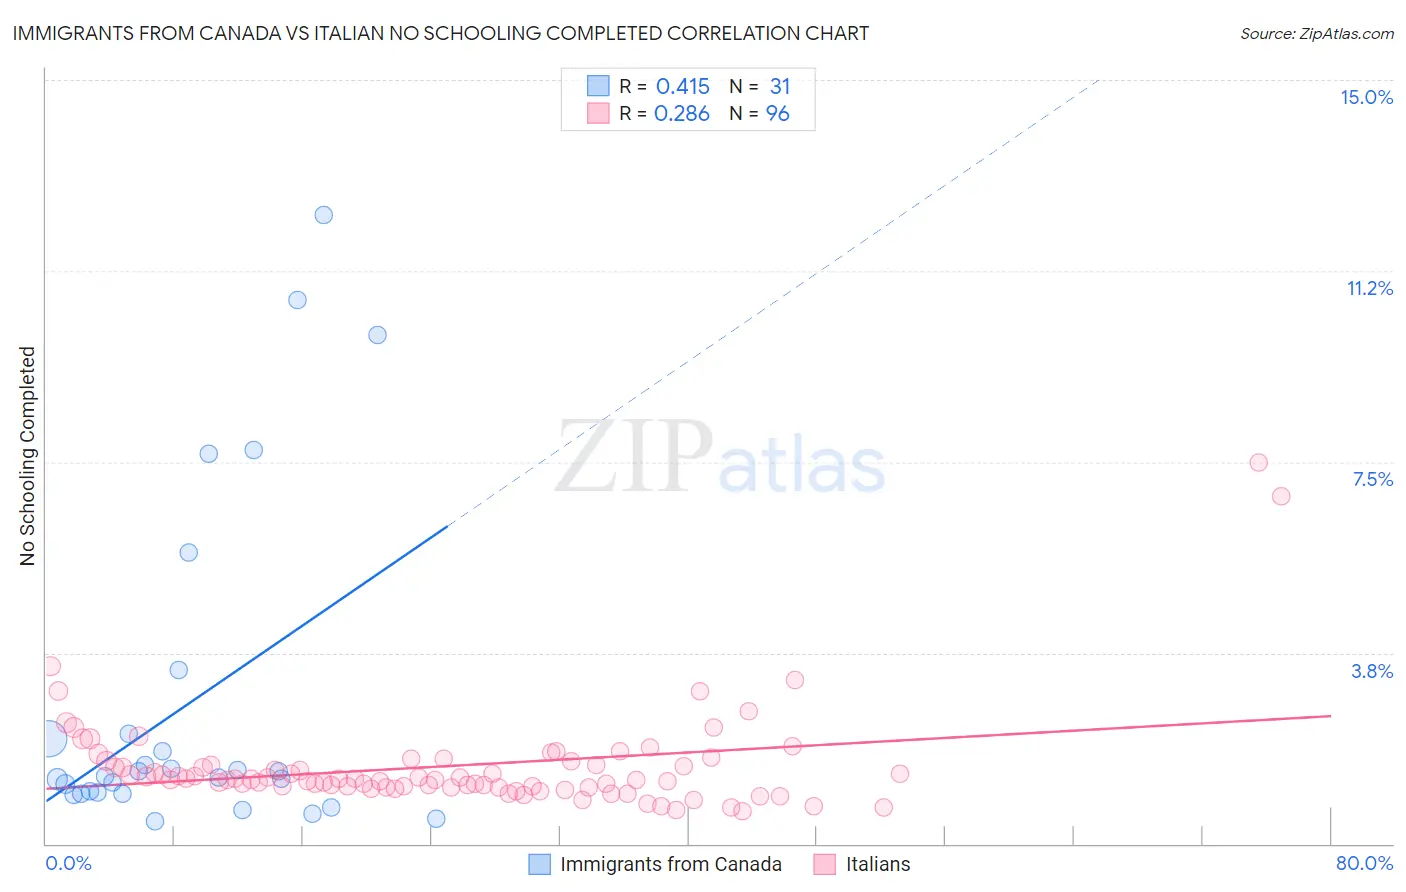
Immigrants from Canada vs Italian No Schooling Completed Correlation Chart
The statistical analysis conducted on geographies consisting of 451,468,489 people shows a moderate positive correlation between the proportion of Immigrants from Canada and percentage of population with no schooling in the United States with a correlation coefficient (R) of 0.415 and weighted average of 1.6%. Similarly, the statistical analysis conducted on geographies consisting of 555,839,647 people shows a weak positive correlation between the proportion of Italians and percentage of population with no schooling in the United States with a correlation coefficient (R) of 0.286 and weighted average of 1.5%, a difference of 6.4%.
No Schooling Completed Correlation Summary
| Measurement | Immigrants from Canada | Italian |
| Minimum | 0.45% | 0.64% |
| Maximum | 12.4% | 7.5% |
| Range | 11.9% | 6.8% |
| Mean | 2.8% | 1.5% |
| Median | 1.3% | 1.3% |
| Interquartile 25% (IQ1) | 0.99% | 1.1% |
| Interquartile 75% (IQ3) | 2.2% | 1.6% |
| Interquartile Range (IQR) | 1.2% | 0.47% |
| Standard Deviation (Sample) | 3.3% | 0.98% |
| Standard Deviation (Population) | 3.3% | 0.98% |
Demographics Similar to Immigrants from Canada and Italians by No Schooling Completed
In terms of no schooling completed, the demographic groups most similar to Immigrants from Canada are Chippewa (1.6%, a difference of 0.070%), Celtic (1.6%, a difference of 0.27%), White/Caucasian (1.6%, a difference of 0.41%), Immigrants from Scotland (1.6%, a difference of 0.46%), and Ottawa (1.6%, a difference of 0.72%). Similarly, the demographic groups most similar to Italians are Latvian (1.5%, a difference of 0.25%), Swiss (1.5%, a difference of 0.68%), Eastern European (1.6%, a difference of 1.2%), Aleut (1.6%, a difference of 2.2%), and Belgian (1.6%, a difference of 2.5%).
| Demographics | Rating | Rank | No Schooling Completed |
| Swiss | 100.0 /100 | #32 | Exceptional 1.5% |
| Italians | 100.0 /100 | #33 | Exceptional 1.5% |
| Latvians | 100.0 /100 | #34 | Exceptional 1.5% |
| Eastern Europeans | 100.0 /100 | #35 | Exceptional 1.6% |
| Aleuts | 99.9 /100 | #36 | Exceptional 1.6% |
| Belgians | 99.9 /100 | #37 | Exceptional 1.6% |
| Northern Europeans | 99.9 /100 | #38 | Exceptional 1.6% |
| Native Hawaiians | 99.9 /100 | #39 | Exceptional 1.6% |
| Luxembourgers | 99.9 /100 | #40 | Exceptional 1.6% |
| Hungarians | 99.9 /100 | #41 | Exceptional 1.6% |
| Bulgarians | 99.9 /100 | #42 | Exceptional 1.6% |
| Australians | 99.9 /100 | #43 | Exceptional 1.6% |
| Estonians | 99.9 /100 | #44 | Exceptional 1.6% |
| Czechoslovakians | 99.9 /100 | #45 | Exceptional 1.6% |
| Maltese | 99.9 /100 | #46 | Exceptional 1.6% |
| Ottawa | 99.9 /100 | #47 | Exceptional 1.6% |
| Immigrants | Scotland | 99.9 /100 | #48 | Exceptional 1.6% |
| Whites/Caucasians | 99.9 /100 | #49 | Exceptional 1.6% |
| Celtics | 99.9 /100 | #50 | Exceptional 1.6% |
| Chippewa | 99.8 /100 | #51 | Exceptional 1.6% |
| Immigrants | Canada | 99.8 /100 | #52 | Exceptional 1.6% |