Immigrants from Canada vs Immigrants from Bosnia and Herzegovina Nursery School
COMPARE
Immigrants from Canada
Immigrants from Bosnia and Herzegovina
Nursery School
Nursery School Comparison
Immigrants from Canada
Immigrants from Bosnia and Herzegovina
98.4%
NURSERY SCHOOL
99.8/ 100
METRIC RATING
59th/ 347
METRIC RANK
98.0%
NURSERY SCHOOL
45.6/ 100
METRIC RATING
180th/ 347
METRIC RANK
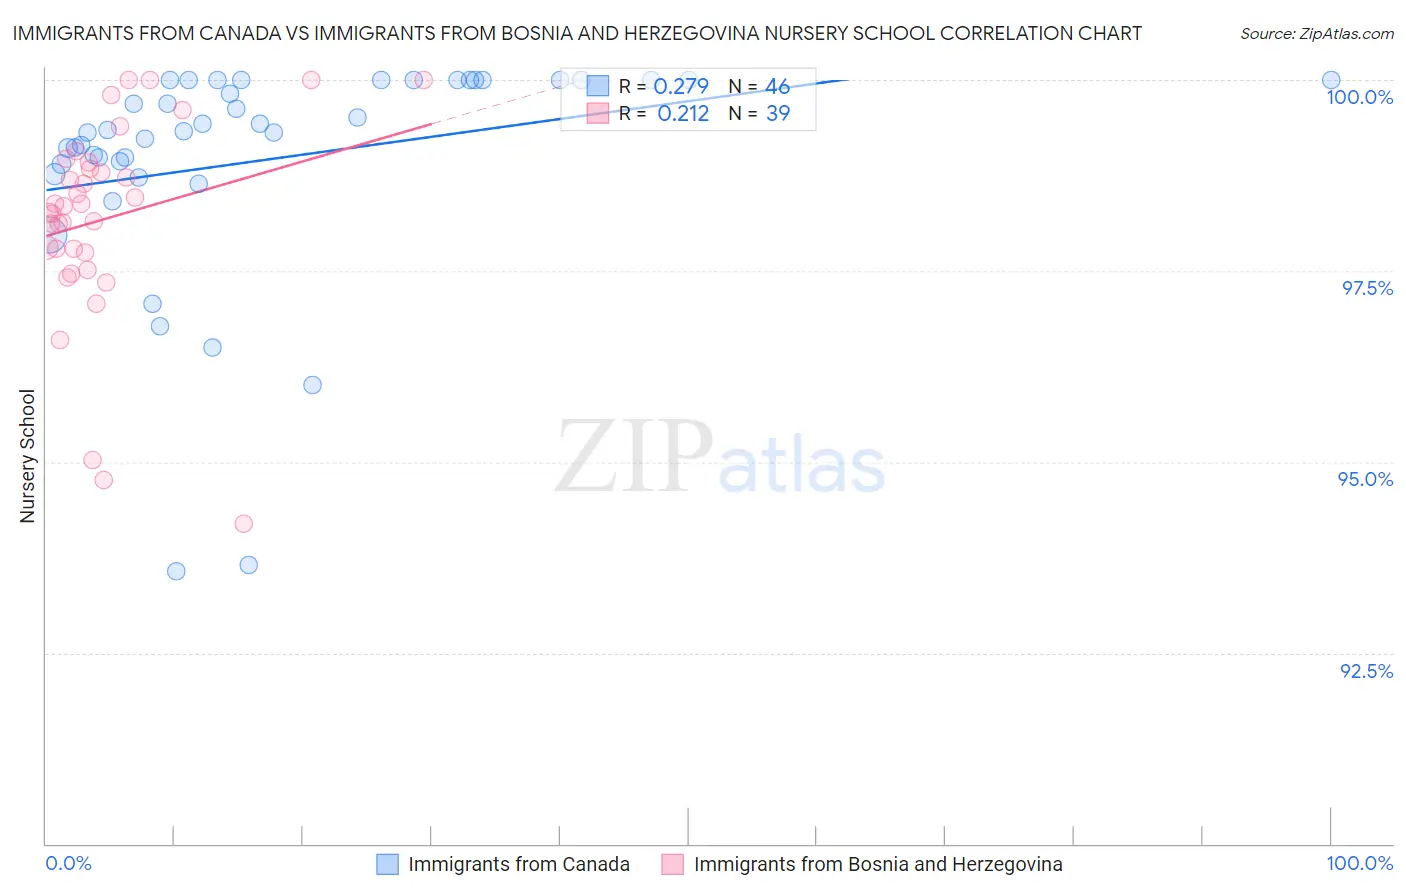
Immigrants from Canada vs Immigrants from Bosnia and Herzegovina Nursery School Correlation Chart
The statistical analysis conducted on geographies consisting of 459,397,554 people shows a weak positive correlation between the proportion of Immigrants from Canada and percentage of population with at least nursery school education in the United States with a correlation coefficient (R) of 0.279 and weighted average of 98.4%. Similarly, the statistical analysis conducted on geographies consisting of 156,779,463 people shows a weak positive correlation between the proportion of Immigrants from Bosnia and Herzegovina and percentage of population with at least nursery school education in the United States with a correlation coefficient (R) of 0.212 and weighted average of 98.0%, a difference of 0.46%.
Nursery School Correlation Summary
| Measurement | Immigrants from Canada | Immigrants from Bosnia and Herzegovina |
| Minimum | 93.6% | 94.2% |
| Maximum | 100.0% | 100.0% |
| Range | 6.4% | 5.8% |
| Mean | 99.0% | 98.2% |
| Median | 99.3% | 98.3% |
| Interquartile 25% (IQ1) | 98.9% | 97.7% |
| Interquartile 75% (IQ3) | 100.0% | 98.9% |
| Interquartile Range (IQR) | 1.1% | 1.2% |
| Standard Deviation (Sample) | 1.5% | 1.3% |
| Standard Deviation (Population) | 1.5% | 1.3% |
Similar Demographics by Nursery School
Demographics Similar to Immigrants from Canada by Nursery School
In terms of nursery school, the demographic groups most similar to Immigrants from Canada are Bulgarian (98.4%, a difference of 0.0%), Slavic (98.4%, a difference of 0.0%), New Zealander (98.4%, a difference of 0.0%), Creek (98.4%, a difference of 0.0%), and Immigrants from North America (98.4%, a difference of 0.0%).
| Demographics | Rating | Rank | Nursery School |
| Australians | 99.8 /100 | #52 | Exceptional 98.5% |
| Kiowa | 99.8 /100 | #53 | Exceptional 98.4% |
| Pueblo | 99.8 /100 | #54 | Exceptional 98.4% |
| Immigrants | Scotland | 99.8 /100 | #55 | Exceptional 98.4% |
| Americans | 99.8 /100 | #56 | Exceptional 98.4% |
| Austrians | 99.8 /100 | #57 | Exceptional 98.4% |
| Bulgarians | 99.8 /100 | #58 | Exceptional 98.4% |
| Immigrants | Canada | 99.8 /100 | #59 | Exceptional 98.4% |
| Slavs | 99.8 /100 | #60 | Exceptional 98.4% |
| New Zealanders | 99.7 /100 | #61 | Exceptional 98.4% |
| Creek | 99.7 /100 | #62 | Exceptional 98.4% |
| Immigrants | North America | 99.7 /100 | #63 | Exceptional 98.4% |
| Greeks | 99.7 /100 | #64 | Exceptional 98.4% |
| Maltese | 99.7 /100 | #65 | Exceptional 98.4% |
| Canadians | 99.7 /100 | #66 | Exceptional 98.4% |
Demographics Similar to Immigrants from Bosnia and Herzegovina by Nursery School
In terms of nursery school, the demographic groups most similar to Immigrants from Bosnia and Herzegovina are Argentinean (98.0%, a difference of 0.0%), Kenyan (98.0%, a difference of 0.010%), Navajo (98.0%, a difference of 0.010%), Immigrants from Sri Lanka (98.0%, a difference of 0.010%), and Immigrants from Venezuela (98.0%, a difference of 0.010%).
| Demographics | Rating | Rank | Nursery School |
| Kenyans | 50.2 /100 | #173 | Average 98.0% |
| Navajo | 50.0 /100 | #174 | Average 98.0% |
| Immigrants | Sri Lanka | 49.9 /100 | #175 | Average 98.0% |
| Immigrants | Venezuela | 49.8 /100 | #176 | Average 98.0% |
| Albanians | 48.9 /100 | #177 | Average 98.0% |
| Natives/Alaskans | 48.6 /100 | #178 | Average 98.0% |
| Argentineans | 46.8 /100 | #179 | Average 98.0% |
| Immigrants | Bosnia and Herzegovina | 45.6 /100 | #180 | Average 98.0% |
| Egyptians | 42.8 /100 | #181 | Average 98.0% |
| Paiute | 42.0 /100 | #182 | Average 98.0% |
| Portuguese | 41.8 /100 | #183 | Average 98.0% |
| Immigrants | Poland | 41.3 /100 | #184 | Average 98.0% |
| Immigrants | Belarus | 41.0 /100 | #185 | Average 98.0% |
| Immigrants | Argentina | 40.8 /100 | #186 | Average 98.0% |
| Immigrants | Kazakhstan | 37.1 /100 | #187 | Fair 97.9% |