Immigrants from Canada vs Carpatho Rusyn 8th Grade
COMPARE
Immigrants from Canada
Carpatho Rusyn
8th Grade
8th Grade Comparison
Immigrants from Canada
Carpatho Rusyns
96.7%
8TH GRADE
99.8/ 100
METRIC RATING
58th/ 347
METRIC RANK
98.1%
8TH GRADE
100.0/ 100
METRIC RATING
4th/ 347
METRIC RANK
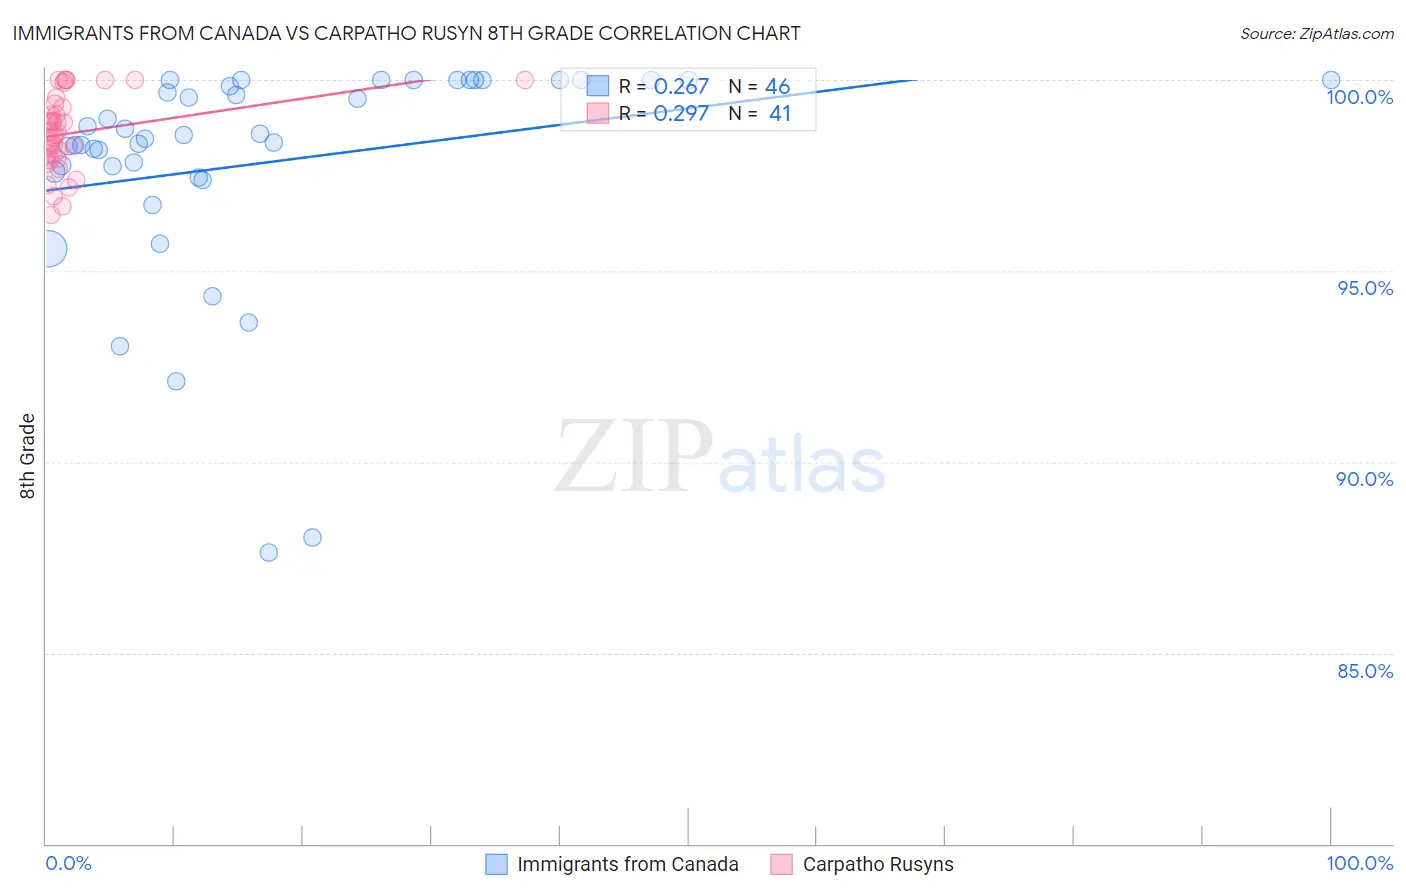
Immigrants from Canada vs Carpatho Rusyn 8th Grade Correlation Chart
The statistical analysis conducted on geographies consisting of 459,397,484 people shows a weak positive correlation between the proportion of Immigrants from Canada and percentage of population with at least 8th grade education in the United States with a correlation coefficient (R) of 0.267 and weighted average of 96.7%. Similarly, the statistical analysis conducted on geographies consisting of 10,071,463 people shows a weak positive correlation between the proportion of Carpatho Rusyns and percentage of population with at least 8th grade education in the United States with a correlation coefficient (R) of 0.297 and weighted average of 98.1%, a difference of 1.5%.
8th Grade Correlation Summary
| Measurement | Immigrants from Canada | Carpatho Rusyn |
| Minimum | 87.6% | 96.4% |
| Maximum | 100.0% | 100.0% |
| Range | 12.4% | 3.6% |
| Mean | 97.8% | 98.6% |
| Median | 98.5% | 98.6% |
| Interquartile 25% (IQ1) | 97.6% | 98.0% |
| Interquartile 75% (IQ3) | 100.0% | 99.3% |
| Interquartile Range (IQR) | 2.4% | 1.4% |
| Standard Deviation (Sample) | 2.9% | 0.98% |
| Standard Deviation (Population) | 2.9% | 0.97% |
Similar Demographics by 8th Grade
Demographics Similar to Immigrants from Canada by 8th Grade
In terms of 8th grade, the demographic groups most similar to Immigrants from Canada are Immigrants from North America (96.7%, a difference of 0.010%), Immigrants from Northern Europe (96.7%, a difference of 0.020%), Immigrants from Austria (96.7%, a difference of 0.020%), White/Caucasian (96.7%, a difference of 0.030%), and Russian (96.7%, a difference of 0.040%).
| Demographics | Rating | Rank | 8th Grade |
| Celtics | 99.9 /100 | #51 | Exceptional 96.8% |
| Greeks | 99.9 /100 | #52 | Exceptional 96.8% |
| Austrians | 99.9 /100 | #53 | Exceptional 96.7% |
| Serbians | 99.8 /100 | #54 | Exceptional 96.7% |
| Russians | 99.8 /100 | #55 | Exceptional 96.7% |
| Australians | 99.8 /100 | #56 | Exceptional 96.7% |
| Macedonians | 99.8 /100 | #57 | Exceptional 96.7% |
| Immigrants | Canada | 99.8 /100 | #58 | Exceptional 96.7% |
| Immigrants | North America | 99.8 /100 | #59 | Exceptional 96.7% |
| Immigrants | Northern Europe | 99.8 /100 | #60 | Exceptional 96.7% |
| Immigrants | Austria | 99.8 /100 | #61 | Exceptional 96.7% |
| Whites/Caucasians | 99.8 /100 | #62 | Exceptional 96.7% |
| Ukrainians | 99.7 /100 | #63 | Exceptional 96.7% |
| Immigrants | India | 99.7 /100 | #64 | Exceptional 96.6% |
| Native Hawaiians | 99.7 /100 | #65 | Exceptional 96.6% |
Demographics Similar to Carpatho Rusyns by 8th Grade
In terms of 8th grade, the demographic groups most similar to Carpatho Rusyns are Ottawa (97.9%, a difference of 0.20%), Finnish (98.4%, a difference of 0.23%), Dutch (97.7%, a difference of 0.49%), Norwegian (97.6%, a difference of 0.55%), and Slovak (97.6%, a difference of 0.59%).
| Demographics | Rating | Rank | 8th Grade |
| Crow | 100.0 /100 | #1 | Exceptional 99.0% |
| Tsimshian | 100.0 /100 | #2 | Exceptional 99.0% |
| Finns | 100.0 /100 | #3 | Exceptional 98.4% |
| Carpatho Rusyns | 100.0 /100 | #4 | Exceptional 98.1% |
| Ottawa | 100.0 /100 | #5 | Exceptional 97.9% |
| Dutch | 100.0 /100 | #6 | Exceptional 97.7% |
| Norwegians | 100.0 /100 | #7 | Exceptional 97.6% |
| Slovaks | 100.0 /100 | #8 | Exceptional 97.6% |
| Germans | 100.0 /100 | #9 | Exceptional 97.5% |
| Slovenes | 100.0 /100 | #10 | Exceptional 97.5% |
| Poles | 100.0 /100 | #11 | Exceptional 97.4% |
| Swedes | 100.0 /100 | #12 | Exceptional 97.4% |
| Alaskan Athabascans | 100.0 /100 | #13 | Exceptional 97.3% |
| English | 100.0 /100 | #14 | Exceptional 97.3% |
| Pennsylvania Germans | 100.0 /100 | #15 | Exceptional 97.3% |