Immigrants from Cameroon vs Italian Nursery School
COMPARE
Immigrants from Cameroon
Italian
Nursery School
Nursery School Comparison
Immigrants from Cameroon
Italians
97.5%
NURSERY SCHOOL
0.1/ 100
METRIC RATING
274th/ 347
METRIC RANK
98.5%
NURSERY SCHOOL
99.9/ 100
METRIC RATING
38th/ 347
METRIC RANK
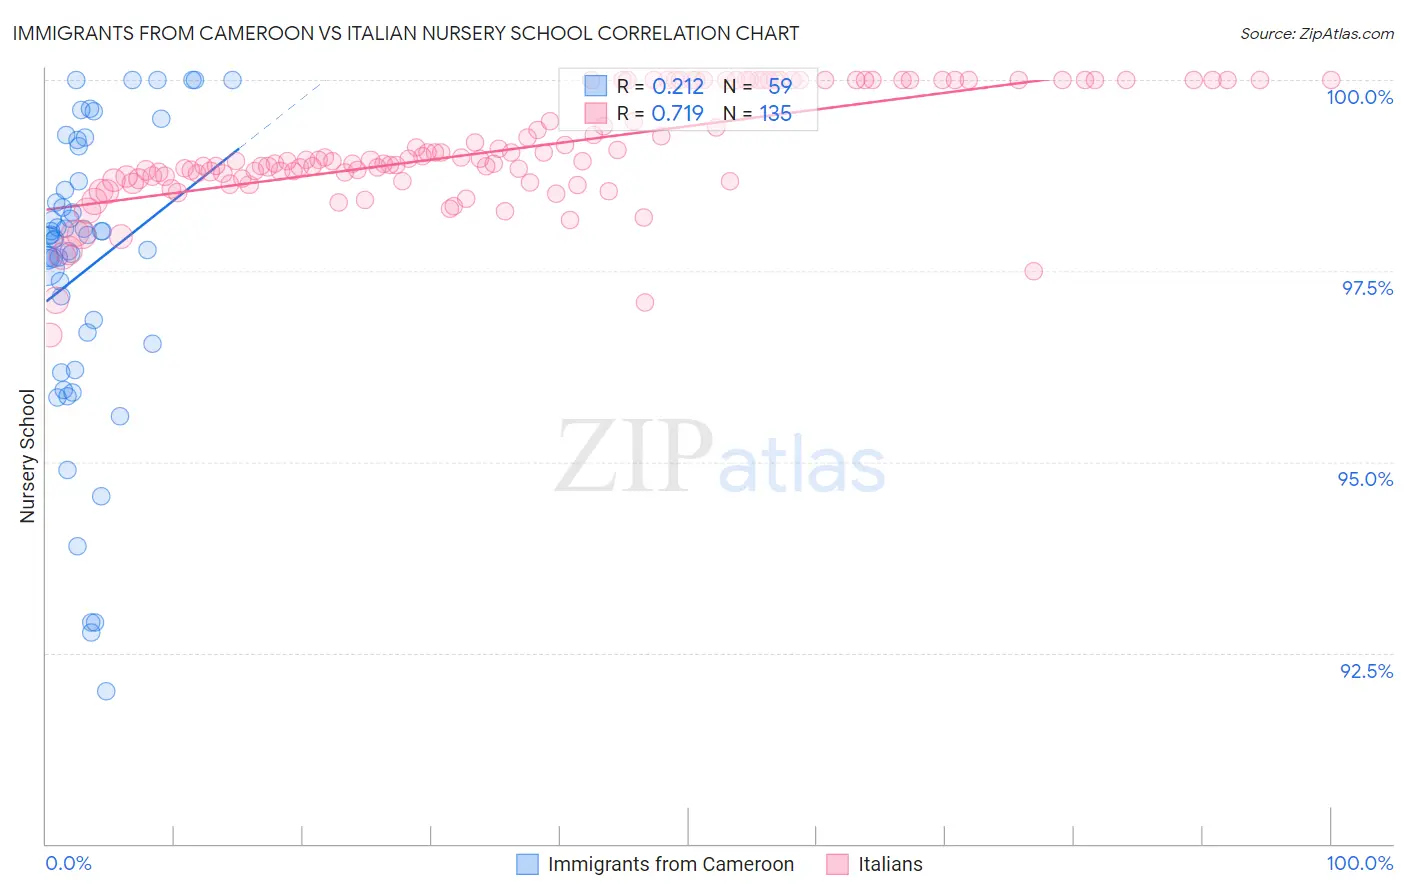
Immigrants from Cameroon vs Italian Nursery School Correlation Chart
The statistical analysis conducted on geographies consisting of 130,769,742 people shows a weak positive correlation between the proportion of Immigrants from Cameroon and percentage of population with at least nursery school education in the United States with a correlation coefficient (R) of 0.212 and weighted average of 97.5%. Similarly, the statistical analysis conducted on geographies consisting of 575,115,824 people shows a strong positive correlation between the proportion of Italians and percentage of population with at least nursery school education in the United States with a correlation coefficient (R) of 0.719 and weighted average of 98.5%, a difference of 1.1%.
Nursery School Correlation Summary
| Measurement | Immigrants from Cameroon | Italian |
| Minimum | 92.0% | 96.7% |
| Maximum | 100.0% | 100.0% |
| Range | 8.0% | 3.3% |
| Mean | 97.5% | 99.1% |
| Median | 98.0% | 98.9% |
| Interquartile 25% (IQ1) | 96.5% | 98.7% |
| Interquartile 75% (IQ3) | 98.7% | 100.0% |
| Interquartile Range (IQR) | 2.1% | 1.3% |
| Standard Deviation (Sample) | 1.9% | 0.72% |
| Standard Deviation (Population) | 1.9% | 0.72% |
Similar Demographics by Nursery School
Demographics Similar to Immigrants from Cameroon by Nursery School
In terms of nursery school, the demographic groups most similar to Immigrants from Cameroon are Immigrants from China (97.5%, a difference of 0.0%), Ghanaian (97.5%, a difference of 0.0%), Immigrants from Bolivia (97.5%, a difference of 0.020%), Immigrants from Philippines (97.5%, a difference of 0.020%), and Immigrants from Western Africa (97.4%, a difference of 0.030%).
| Demographics | Rating | Rank | Nursery School |
| Immigrants | Nigeria | 0.3 /100 | #267 | Tragic 97.5% |
| West Indians | 0.3 /100 | #268 | Tragic 97.5% |
| Immigrants | Liberia | 0.3 /100 | #269 | Tragic 97.5% |
| Immigrants | Jamaica | 0.2 /100 | #270 | Tragic 97.5% |
| Immigrants | Peru | 0.2 /100 | #271 | Tragic 97.5% |
| Immigrants | Bolivia | 0.1 /100 | #272 | Tragic 97.5% |
| Immigrants | China | 0.1 /100 | #273 | Tragic 97.5% |
| Immigrants | Cameroon | 0.1 /100 | #274 | Tragic 97.5% |
| Ghanaians | 0.1 /100 | #275 | Tragic 97.5% |
| Immigrants | Philippines | 0.1 /100 | #276 | Tragic 97.5% |
| Immigrants | Western Africa | 0.1 /100 | #277 | Tragic 97.4% |
| Immigrants | Uzbekistan | 0.1 /100 | #278 | Tragic 97.4% |
| Immigrants | Ghana | 0.1 /100 | #279 | Tragic 97.4% |
| Barbadians | 0.0 /100 | #280 | Tragic 97.4% |
| Trinidadians and Tobagonians | 0.0 /100 | #281 | Tragic 97.4% |
Demographics Similar to Italians by Nursery School
In terms of nursery school, the demographic groups most similar to Italians are Lumbee (98.5%, a difference of 0.0%), Latvian (98.5%, a difference of 0.0%), Chippewa (98.5%, a difference of 0.010%), British (98.5%, a difference of 0.020%), and Luxembourger (98.5%, a difference of 0.020%).
| Demographics | Rating | Rank | Nursery School |
| Czechs | 100.0 /100 | #31 | Exceptional 98.6% |
| French Canadians | 100.0 /100 | #32 | Exceptional 98.6% |
| Scandinavians | 100.0 /100 | #33 | Exceptional 98.6% |
| Chinese | 100.0 /100 | #34 | Exceptional 98.6% |
| Swiss | 100.0 /100 | #35 | Exceptional 98.6% |
| British | 100.0 /100 | #36 | Exceptional 98.5% |
| Lumbee | 99.9 /100 | #37 | Exceptional 98.5% |
| Italians | 99.9 /100 | #38 | Exceptional 98.5% |
| Latvians | 99.9 /100 | #39 | Exceptional 98.5% |
| Chippewa | 99.9 /100 | #40 | Exceptional 98.5% |
| Luxembourgers | 99.9 /100 | #41 | Exceptional 98.5% |
| Eastern Europeans | 99.9 /100 | #42 | Exceptional 98.5% |
| Native Hawaiians | 99.9 /100 | #43 | Exceptional 98.5% |
| Belgians | 99.9 /100 | #44 | Exceptional 98.5% |
| Northern Europeans | 99.9 /100 | #45 | Exceptional 98.5% |