Immigrants from Cameroon vs Immigrants from Africa 8th Grade
COMPARE
Immigrants from Cameroon
Immigrants from Africa
8th Grade
8th Grade Comparison
Immigrants from Cameroon
Immigrants from Africa
95.0%
8TH GRADE
0.8/ 100
METRIC RATING
254th/ 347
METRIC RANK
95.2%
8TH GRADE
2.7/ 100
METRIC RATING
237th/ 347
METRIC RANK
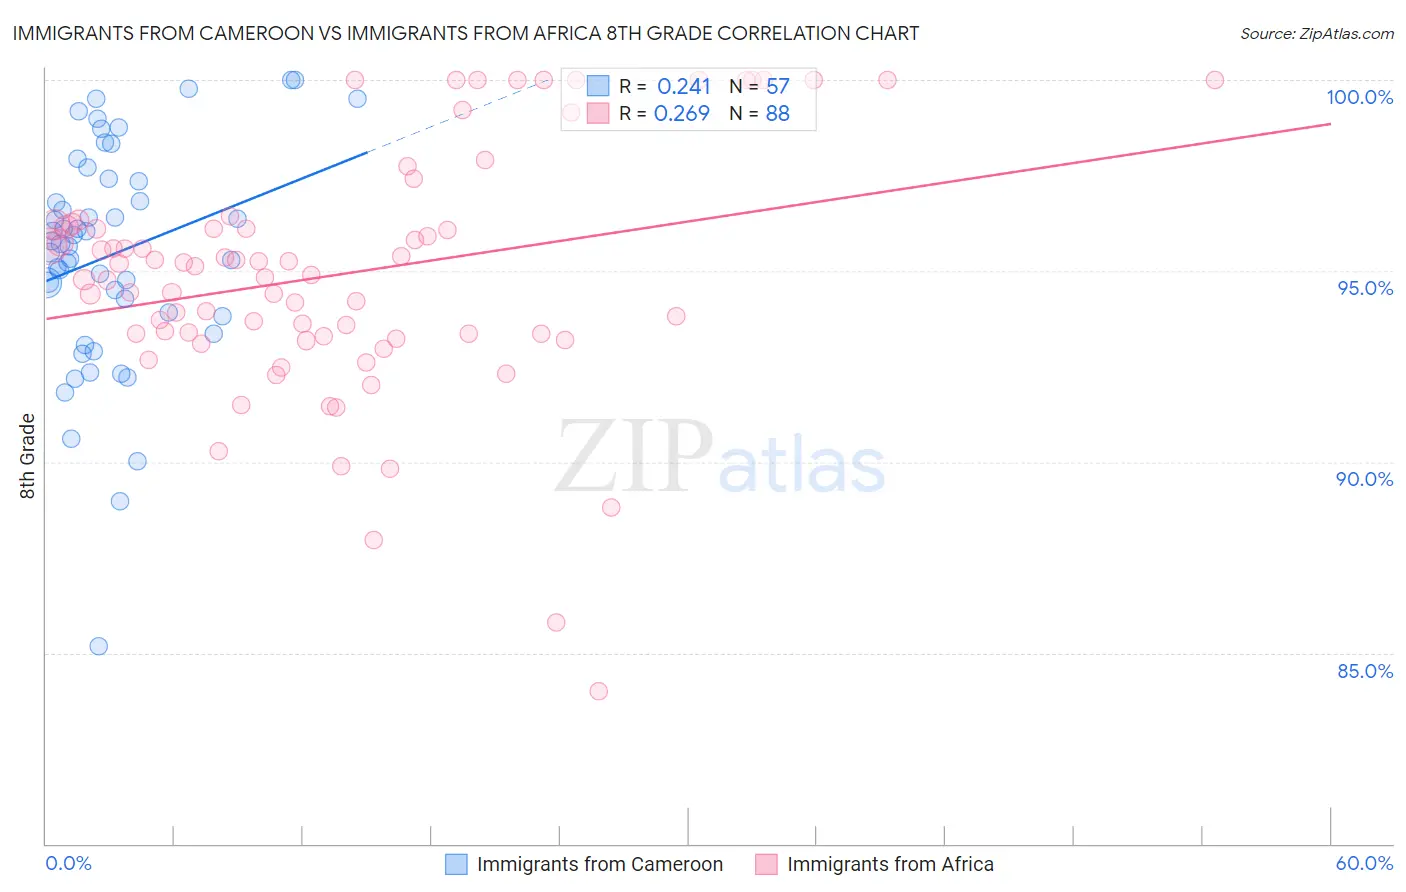
Immigrants from Cameroon vs Immigrants from Africa 8th Grade Correlation Chart
The statistical analysis conducted on geographies consisting of 130,618,704 people shows a weak positive correlation between the proportion of Immigrants from Cameroon and percentage of population with at least 8th grade education in the United States with a correlation coefficient (R) of 0.241 and weighted average of 95.0%. Similarly, the statistical analysis conducted on geographies consisting of 469,408,495 people shows a weak positive correlation between the proportion of Immigrants from Africa and percentage of population with at least 8th grade education in the United States with a correlation coefficient (R) of 0.269 and weighted average of 95.2%, a difference of 0.20%.
8th Grade Correlation Summary
| Measurement | Immigrants from Cameroon | Immigrants from Africa |
| Minimum | 85.2% | 84.0% |
| Maximum | 100.0% | 100.0% |
| Range | 14.8% | 16.0% |
| Mean | 95.4% | 94.9% |
| Median | 95.7% | 95.0% |
| Interquartile 25% (IQ1) | 93.9% | 93.3% |
| Interquartile 75% (IQ3) | 97.4% | 96.2% |
| Interquartile Range (IQR) | 3.5% | 2.9% |
| Standard Deviation (Sample) | 2.9% | 3.2% |
| Standard Deviation (Population) | 2.9% | 3.2% |
Demographics Similar to Immigrants from Cameroon and Immigrants from Africa by 8th Grade
In terms of 8th grade, the demographic groups most similar to Immigrants from Cameroon are U.S. Virgin Islander (95.0%, a difference of 0.020%), Immigrants from Somalia (95.0%, a difference of 0.020%), Bolivian (95.0%, a difference of 0.030%), Immigrants from Ethiopia (95.0%, a difference of 0.030%), and Korean (95.0%, a difference of 0.040%). Similarly, the demographic groups most similar to Immigrants from Africa are Senegalese (95.2%, a difference of 0.0%), Nigerian (95.2%, a difference of 0.020%), Native/Alaskan (95.2%, a difference of 0.030%), Immigrants from Sierra Leone (95.1%, a difference of 0.040%), and Ethiopian (95.1%, a difference of 0.050%).
| Demographics | Rating | Rank | 8th Grade |
| Nigerians | 2.9 /100 | #235 | Tragic 95.2% |
| Senegalese | 2.7 /100 | #236 | Tragic 95.2% |
| Immigrants | Africa | 2.7 /100 | #237 | Tragic 95.2% |
| Natives/Alaskans | 2.3 /100 | #238 | Tragic 95.2% |
| Immigrants | Sierra Leone | 2.1 /100 | #239 | Tragic 95.1% |
| Ethiopians | 2.0 /100 | #240 | Tragic 95.1% |
| South American Indians | 1.9 /100 | #241 | Tragic 95.1% |
| Tongans | 1.7 /100 | #242 | Tragic 95.1% |
| Paiute | 1.7 /100 | #243 | Tragic 95.1% |
| Immigrants | Middle Africa | 1.7 /100 | #244 | Tragic 95.1% |
| Jamaicans | 1.4 /100 | #245 | Tragic 95.1% |
| Somalis | 1.4 /100 | #246 | Tragic 95.1% |
| Immigrants | Senegal | 1.4 /100 | #247 | Tragic 95.1% |
| Uruguayans | 1.2 /100 | #248 | Tragic 95.1% |
| Immigrants | China | 1.1 /100 | #249 | Tragic 95.0% |
| Koreans | 1.1 /100 | #250 | Tragic 95.0% |
| Bolivians | 1.0 /100 | #251 | Tragic 95.0% |
| Immigrants | Ethiopia | 1.0 /100 | #252 | Tragic 95.0% |
| U.S. Virgin Islanders | 0.9 /100 | #253 | Tragic 95.0% |
| Immigrants | Cameroon | 0.8 /100 | #254 | Tragic 95.0% |
| Immigrants | Somalia | 0.7 /100 | #255 | Tragic 95.0% |