Immigrants from Cameroon vs Filipino GED/Equivalency
COMPARE
Immigrants from Cameroon
Filipino
GED/Equivalency
GED/Equivalency Comparison
Immigrants from Cameroon
Filipinos
84.9%
GED/EQUIVALENCY
12.1/ 100
METRIC RATING
210th/ 347
METRIC RANK
89.5%
GED/EQUIVALENCY
100.0/ 100
METRIC RATING
2nd/ 347
METRIC RANK
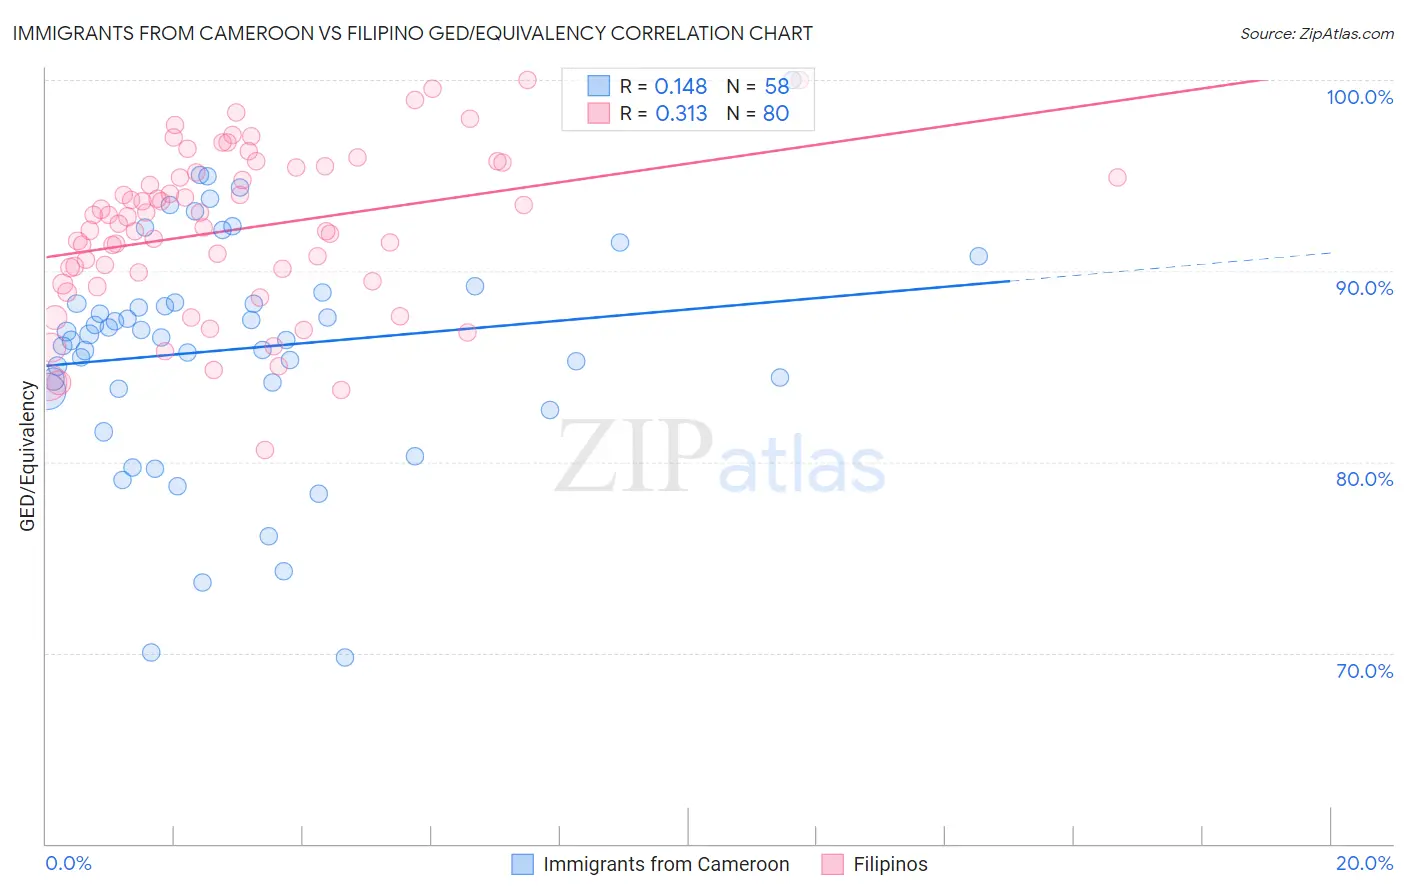
Immigrants from Cameroon vs Filipino GED/Equivalency Correlation Chart
The statistical analysis conducted on geographies consisting of 130,768,734 people shows a poor positive correlation between the proportion of Immigrants from Cameroon and percentage of population with at least ged/equivalency education in the United States with a correlation coefficient (R) of 0.148 and weighted average of 84.9%. Similarly, the statistical analysis conducted on geographies consisting of 254,349,672 people shows a mild positive correlation between the proportion of Filipinos and percentage of population with at least ged/equivalency education in the United States with a correlation coefficient (R) of 0.313 and weighted average of 89.5%, a difference of 5.5%.
GED/Equivalency Correlation Summary
| Measurement | Immigrants from Cameroon | Filipino |
| Minimum | 69.8% | 80.6% |
| Maximum | 100.0% | 100.0% |
| Range | 30.2% | 19.4% |
| Mean | 85.9% | 92.2% |
| Median | 86.6% | 92.7% |
| Interquartile 25% (IQ1) | 83.8% | 89.7% |
| Interquartile 75% (IQ3) | 88.3% | 95.3% |
| Interquartile Range (IQR) | 4.5% | 5.6% |
| Standard Deviation (Sample) | 6.0% | 4.2% |
| Standard Deviation (Population) | 5.9% | 4.2% |
Similar Demographics by GED/Equivalency
Demographics Similar to Immigrants from Cameroon by GED/Equivalency
In terms of ged/equivalency, the demographic groups most similar to Immigrants from Cameroon are Colombian (84.9%, a difference of 0.010%), Marshallese (84.9%, a difference of 0.020%), Hmong (84.9%, a difference of 0.050%), South American (84.8%, a difference of 0.060%), and Samoan (84.9%, a difference of 0.070%).
| Demographics | Rating | Rank | GED/Equivalency |
| Panamanians | 15.3 /100 | #203 | Poor 85.0% |
| Hawaiians | 15.2 /100 | #204 | Poor 85.0% |
| Liberians | 14.6 /100 | #205 | Poor 85.0% |
| Samoans | 13.7 /100 | #206 | Poor 84.9% |
| Hmong | 13.1 /100 | #207 | Poor 84.9% |
| Marshallese | 12.5 /100 | #208 | Poor 84.9% |
| Colombians | 12.3 /100 | #209 | Poor 84.9% |
| Immigrants | Cameroon | 12.1 /100 | #210 | Poor 84.9% |
| South Americans | 10.9 /100 | #211 | Poor 84.8% |
| Immigrants | Somalia | 10.6 /100 | #212 | Poor 84.8% |
| Immigrants | Philippines | 10.0 /100 | #213 | Poor 84.8% |
| Osage | 9.5 /100 | #214 | Tragic 84.8% |
| Peruvians | 9.2 /100 | #215 | Tragic 84.7% |
| Immigrants | Micronesia | 8.7 /100 | #216 | Tragic 84.7% |
| Nigerians | 8.6 /100 | #217 | Tragic 84.7% |
Demographics Similar to Filipinos by GED/Equivalency
In terms of ged/equivalency, the demographic groups most similar to Filipinos are Immigrants from Singapore (89.3%, a difference of 0.21%), Immigrants from India (89.7%, a difference of 0.26%), Iranian (89.2%, a difference of 0.30%), Latvian (89.2%, a difference of 0.40%), and Thai (89.1%, a difference of 0.42%).
| Demographics | Rating | Rank | GED/Equivalency |
| Immigrants | India | 100.0 /100 | #1 | Exceptional 89.7% |
| Filipinos | 100.0 /100 | #2 | Exceptional 89.5% |
| Immigrants | Singapore | 100.0 /100 | #3 | Exceptional 89.3% |
| Iranians | 100.0 /100 | #4 | Exceptional 89.2% |
| Latvians | 100.0 /100 | #5 | Exceptional 89.2% |
| Thais | 100.0 /100 | #6 | Exceptional 89.1% |
| Eastern Europeans | 99.9 /100 | #7 | Exceptional 89.1% |
| Carpatho Rusyns | 99.9 /100 | #8 | Exceptional 89.1% |
| Chinese | 99.9 /100 | #9 | Exceptional 89.0% |
| Norwegians | 99.9 /100 | #10 | Exceptional 89.0% |
| Bulgarians | 99.9 /100 | #11 | Exceptional 89.0% |
| Lithuanians | 99.9 /100 | #12 | Exceptional 88.9% |
| Immigrants | Iran | 99.9 /100 | #13 | Exceptional 88.9% |
| Cypriots | 99.9 /100 | #14 | Exceptional 88.9% |
| Okinawans | 99.9 /100 | #15 | Exceptional 88.9% |