Immigrants from Cambodia vs Pueblo Associate's Degree
COMPARE
Immigrants from Cambodia
Pueblo
Associate's Degree
Associate's Degree Comparison
Immigrants from Cambodia
Pueblo
42.3%
ASSOCIATE'S DEGREE
0.9/ 100
METRIC RATING
245th/ 347
METRIC RANK
34.0%
ASSOCIATE'S DEGREE
0.0/ 100
METRIC RATING
338th/ 347
METRIC RANK
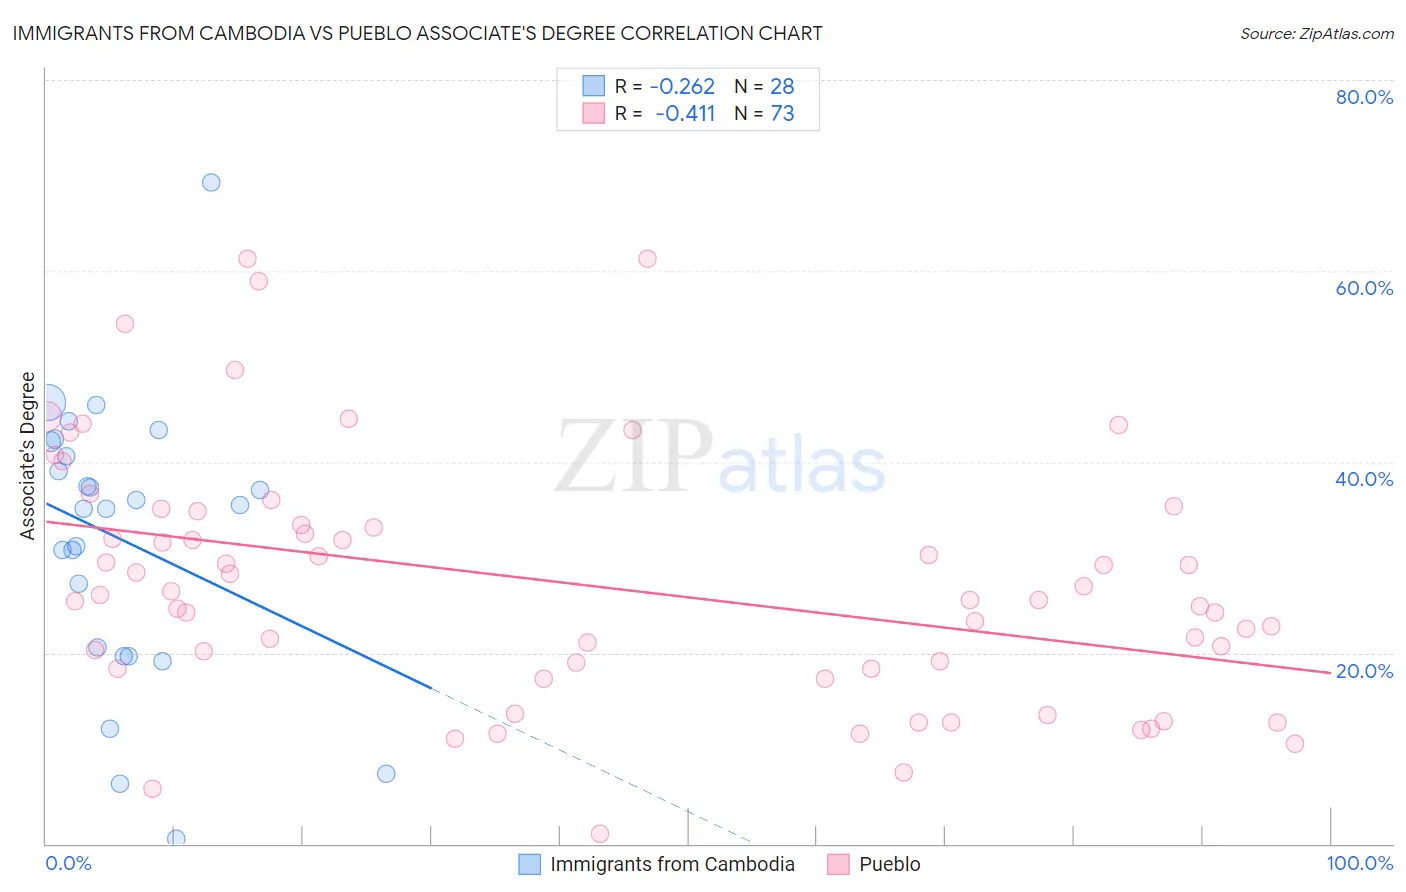
Immigrants from Cambodia vs Pueblo Associate's Degree Correlation Chart
The statistical analysis conducted on geographies consisting of 205,153,213 people shows a weak negative correlation between the proportion of Immigrants from Cambodia and percentage of population with at least associate's degree education in the United States with a correlation coefficient (R) of -0.262 and weighted average of 42.3%. Similarly, the statistical analysis conducted on geographies consisting of 120,085,787 people shows a moderate negative correlation between the proportion of Pueblo and percentage of population with at least associate's degree education in the United States with a correlation coefficient (R) of -0.411 and weighted average of 34.0%, a difference of 24.4%.
Associate's Degree Correlation Summary
| Measurement | Immigrants from Cambodia | Pueblo |
| Minimum | 0.50% | 1.1% |
| Maximum | 69.2% | 61.3% |
| Range | 68.7% | 60.3% |
| Mean | 31.9% | 27.2% |
| Median | 35.3% | 25.6% |
| Interquartile 25% (IQ1) | 20.1% | 18.3% |
| Interquartile 75% (IQ3) | 41.4% | 34.1% |
| Interquartile Range (IQR) | 21.2% | 15.8% |
| Standard Deviation (Sample) | 14.7% | 13.0% |
| Standard Deviation (Population) | 14.4% | 13.0% |
Similar Demographics by Associate's Degree
Demographics Similar to Immigrants from Cambodia by Associate's Degree
In terms of associate's degree, the demographic groups most similar to Immigrants from Cambodia are Immigrants from Liberia (42.3%, a difference of 0.020%), Delaware (42.3%, a difference of 0.030%), Immigrants from Fiji (42.2%, a difference of 0.12%), Guyanese (42.3%, a difference of 0.16%), and Immigrants from Ecuador (42.2%, a difference of 0.20%).
| Demographics | Rating | Rank | Associate's Degree |
| Iroquois | 1.7 /100 | #238 | Tragic 42.8% |
| Immigrants | Grenada | 1.3 /100 | #239 | Tragic 42.6% |
| Cree | 1.2 /100 | #240 | Tragic 42.5% |
| British West Indians | 1.0 /100 | #241 | Tragic 42.4% |
| Immigrants | West Indies | 1.0 /100 | #242 | Tragic 42.4% |
| Guyanese | 1.0 /100 | #243 | Tragic 42.3% |
| Immigrants | Liberia | 0.9 /100 | #244 | Tragic 42.3% |
| Immigrants | Cambodia | 0.9 /100 | #245 | Tragic 42.3% |
| Delaware | 0.9 /100 | #246 | Tragic 42.3% |
| Immigrants | Fiji | 0.8 /100 | #247 | Tragic 42.2% |
| Immigrants | Ecuador | 0.8 /100 | #248 | Tragic 42.2% |
| Jamaicans | 0.7 /100 | #249 | Tragic 42.1% |
| U.S. Virgin Islanders | 0.7 /100 | #250 | Tragic 42.1% |
| Immigrants | Bahamas | 0.7 /100 | #251 | Tragic 42.1% |
| French American Indians | 0.6 /100 | #252 | Tragic 42.0% |
Demographics Similar to Pueblo by Associate's Degree
In terms of associate's degree, the demographic groups most similar to Pueblo are Lumbee (34.1%, a difference of 0.41%), Immigrants from Mexico (33.7%, a difference of 0.71%), Hopi (34.6%, a difference of 1.7%), Spanish American Indian (34.9%, a difference of 2.6%), and Native/Alaskan (34.9%, a difference of 2.8%).
| Demographics | Rating | Rank | Associate's Degree |
| Immigrants | Azores | 0.0 /100 | #331 | Tragic 35.6% |
| Immigrants | Central America | 0.0 /100 | #332 | Tragic 35.0% |
| Mexicans | 0.0 /100 | #333 | Tragic 35.0% |
| Natives/Alaskans | 0.0 /100 | #334 | Tragic 34.9% |
| Spanish American Indians | 0.0 /100 | #335 | Tragic 34.9% |
| Hopi | 0.0 /100 | #336 | Tragic 34.6% |
| Lumbee | 0.0 /100 | #337 | Tragic 34.1% |
| Pueblo | 0.0 /100 | #338 | Tragic 34.0% |
| Immigrants | Mexico | 0.0 /100 | #339 | Tragic 33.7% |
| Navajo | 0.0 /100 | #340 | Tragic 32.6% |
| Inupiat | 0.0 /100 | #341 | Tragic 32.6% |
| Yakama | 0.0 /100 | #342 | Tragic 32.3% |
| Tohono O'odham | 0.0 /100 | #343 | Tragic 31.8% |
| Yuman | 0.0 /100 | #344 | Tragic 31.3% |
| Pima | 0.0 /100 | #345 | Tragic 30.2% |