Immigrants from Cabo Verde vs Zimbabwean 6th Grade
COMPARE
Immigrants from Cabo Verde
Zimbabwean
6th Grade
6th Grade Comparison
Immigrants from Cabo Verde
Zimbabweans
94.4%
6TH GRADE
0.0/ 100
METRIC RATING
338th/ 347
METRIC RANK
97.6%
6TH GRADE
99.1/ 100
METRIC RATING
82nd/ 347
METRIC RANK
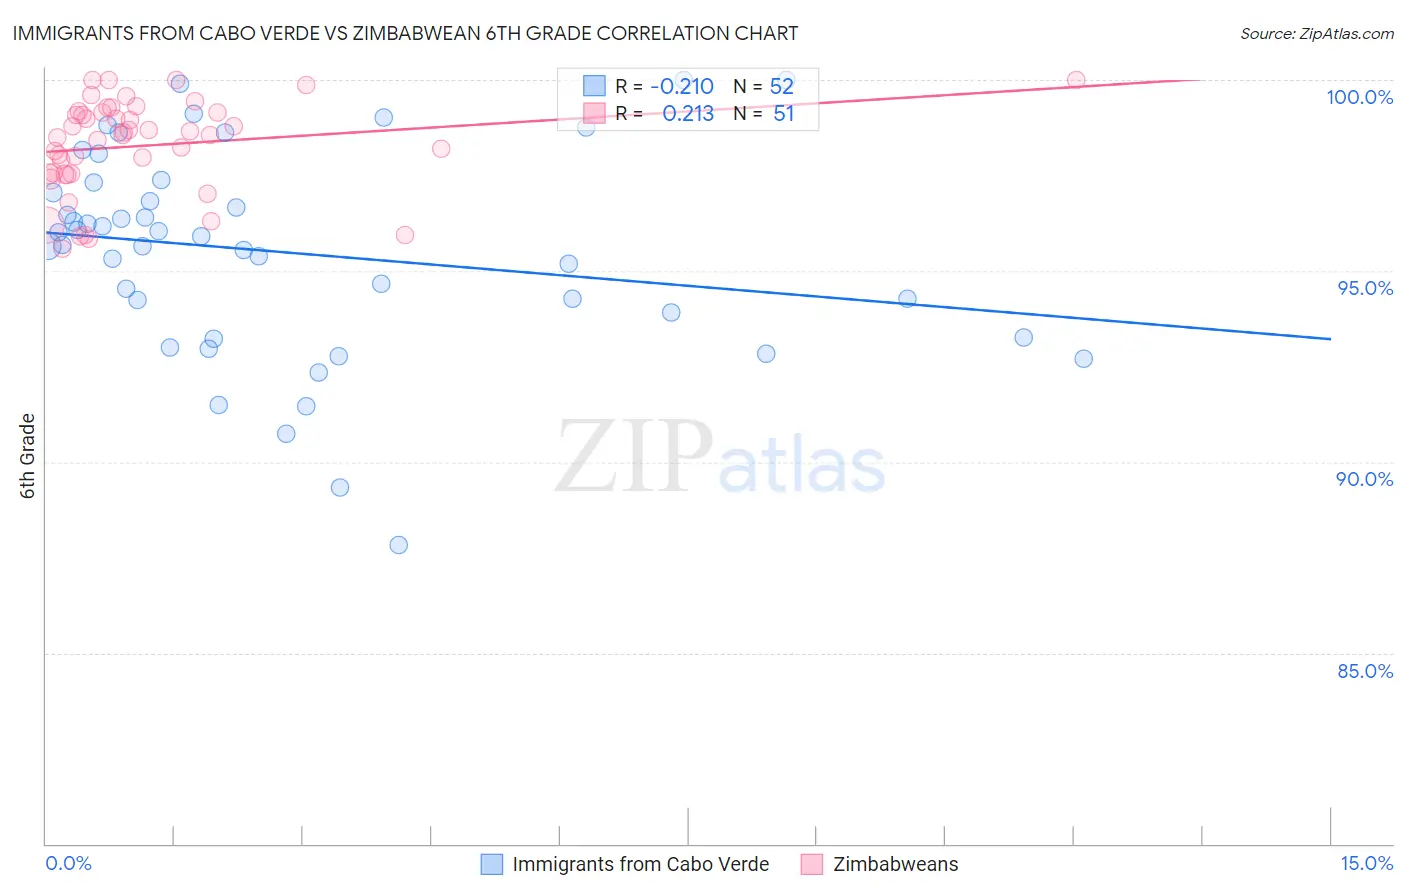
Immigrants from Cabo Verde vs Zimbabwean 6th Grade Correlation Chart
The statistical analysis conducted on geographies consisting of 38,113,948 people shows a weak negative correlation between the proportion of Immigrants from Cabo Verde and percentage of population with at least 6th grade education in the United States with a correlation coefficient (R) of -0.210 and weighted average of 94.4%. Similarly, the statistical analysis conducted on geographies consisting of 69,203,423 people shows a weak positive correlation between the proportion of Zimbabweans and percentage of population with at least 6th grade education in the United States with a correlation coefficient (R) of 0.213 and weighted average of 97.6%, a difference of 3.3%.
6th Grade Correlation Summary
| Measurement | Immigrants from Cabo Verde | Zimbabwean |
| Minimum | 87.8% | 95.6% |
| Maximum | 100.0% | 100.0% |
| Range | 12.2% | 4.4% |
| Mean | 95.5% | 98.3% |
| Median | 95.8% | 98.6% |
| Interquartile 25% (IQ1) | 93.6% | 97.5% |
| Interquartile 75% (IQ3) | 97.2% | 99.2% |
| Interquartile Range (IQR) | 3.6% | 1.6% |
| Standard Deviation (Sample) | 2.7% | 1.2% |
| Standard Deviation (Population) | 2.7% | 1.2% |
Similar Demographics by 6th Grade
Demographics Similar to Immigrants from Cabo Verde by 6th Grade
In terms of 6th grade, the demographic groups most similar to Immigrants from Cabo Verde are Central American (94.5%, a difference of 0.010%), Yakama (94.3%, a difference of 0.15%), Immigrants from Dominican Republic (94.6%, a difference of 0.18%), Mexican (94.6%, a difference of 0.20%), and Immigrants from the Azores (94.7%, a difference of 0.23%).
| Demographics | Rating | Rank | 6th Grade |
| Immigrants | Armenia | 0.0 /100 | #331 | Tragic 94.9% |
| Immigrants | Honduras | 0.0 /100 | #332 | Tragic 94.8% |
| Immigrants | Latin America | 0.0 /100 | #333 | Tragic 94.7% |
| Immigrants | Azores | 0.0 /100 | #334 | Tragic 94.7% |
| Mexicans | 0.0 /100 | #335 | Tragic 94.6% |
| Immigrants | Dominican Republic | 0.0 /100 | #336 | Tragic 94.6% |
| Central Americans | 0.0 /100 | #337 | Tragic 94.5% |
| Immigrants | Cabo Verde | 0.0 /100 | #338 | Tragic 94.4% |
| Yakama | 0.0 /100 | #339 | Tragic 94.3% |
| Guatemalans | 0.0 /100 | #340 | Tragic 94.2% |
| Immigrants | Yemen | 0.0 /100 | #341 | Tragic 94.1% |
| Immigrants | Central America | 0.0 /100 | #342 | Tragic 94.0% |
| Immigrants | Mexico | 0.0 /100 | #343 | Tragic 93.9% |
| Immigrants | Guatemala | 0.0 /100 | #344 | Tragic 93.9% |
| Salvadorans | 0.0 /100 | #345 | Tragic 93.9% |
Demographics Similar to Zimbabweans by 6th Grade
In terms of 6th grade, the demographic groups most similar to Zimbabweans are Lumbee (97.6%, a difference of 0.0%), Potawatomi (97.6%, a difference of 0.010%), Shoshone (97.6%, a difference of 0.010%), Immigrants from Lithuania (97.6%, a difference of 0.020%), and Icelander (97.6%, a difference of 0.020%).
| Demographics | Rating | Rank | 6th Grade |
| Ukrainians | 99.4 /100 | #75 | Exceptional 97.6% |
| Immigrants | England | 99.4 /100 | #76 | Exceptional 97.6% |
| Immigrants | Lithuania | 99.3 /100 | #77 | Exceptional 97.6% |
| Icelanders | 99.3 /100 | #78 | Exceptional 97.6% |
| Immigrants | India | 99.3 /100 | #79 | Exceptional 97.6% |
| Osage | 99.3 /100 | #80 | Exceptional 97.6% |
| Lumbee | 99.2 /100 | #81 | Exceptional 97.6% |
| Zimbabweans | 99.1 /100 | #82 | Exceptional 97.6% |
| Potawatomi | 99.1 /100 | #83 | Exceptional 97.6% |
| Shoshone | 99.0 /100 | #84 | Exceptional 97.6% |
| Delaware | 98.9 /100 | #85 | Exceptional 97.6% |
| Immigrants | Belgium | 98.9 /100 | #86 | Exceptional 97.5% |
| Puget Sound Salish | 98.9 /100 | #87 | Exceptional 97.5% |
| Immigrants | South Africa | 98.9 /100 | #88 | Exceptional 97.5% |
| Immigrants | Australia | 98.8 /100 | #89 | Exceptional 97.5% |