Immigrants from Cabo Verde vs Burmese GED/Equivalency

COMPARE

Immigrants from Cabo Verde
Race
Ancestry
AfghanAfricanAlaska NativeAlaskan AthabascanAlbanianAleutAlsatianAmericanApacheArabArapahoArgentineanArmenianAssyrian/Chaldean/SyriacAustralianAustrianBahamianBangladeshiBarbadianBasqueBelgianBelizeanBermudanBhutaneseBlackfeetBolivianBrazilianBritishBritish West IndianBulgarianCajunCambodianCanadianCape VerdeanCarpatho RusynCelticCentral AmericanCentral American IndianCherokeeCheyenneChickasawChileanChineseChippewaChoctawColombianColvilleComancheCosta RicanCreeCreekCroatianCrowCubanCypriotCzechCzechoslovakianDanishDelawareDominicanDutchDutch West IndianEastern EuropeanEcuadorianEgyptianEnglishEstonianEthiopianEuropeanFijianFilipinoFinnishFrenchFrench American IndianFrench CanadianGermanGerman RussianGhanaianGreekGuamanian/ChamorroGuatemalanGuyaneseHaitianHmongHonduranHopiHoumaHungarianIcelanderIndian (Asian)IndonesianInupiatIranianIraqiIrishIroquoisIsraeliItalianJamaicanJapaneseJordanianKenyanKiowaKoreanLaotianLatvianLebaneseLiberianLithuanianLumbeeLuxembourgerMacedonianMalaysianMalteseMarshalleseMenomineeMexicanMexican American IndianMongolianMoroccanNative HawaiianNavajoNepaleseNew ZealanderNicaraguanNigerianNorthern EuropeanNorwegianOkinawanOsageOttawaPaiutePakistaniPalestinianPanamanianParaguayanPennsylvania GermanPeruvianPimaPolishPortuguesePotawatomiPuebloPuerto RicanPuget Sound SalishRomanianRussianSalvadoranSamoanScandinavianScotch-IrishScottishSeminoleSenegaleseSerbianShoshoneSierra LeoneanSiouxSlavicSlovakSloveneSomaliSouth AfricanSouth AmericanSouth American IndianSoviet UnionSpaniardSpanishSpanish AmericanSpanish American IndianSri LankanSubsaharan AfricanSudaneseSwedishSwissSyrianTaiwaneseThaiTlingit-HaidaTohono O'OdhamTonganTrinidadian and TobagonianTsimshianTurkishU.S. Virgin IslanderUgandanUkrainianUruguayanUteVenezuelanVietnameseWelshWest IndianYakamaYaquiYugoslavianYumanYup'ikZimbabwean
Immigration
NonimmigrantsImmigrantsAfghanistanAfricaAlbaniaArgentinaArmeniaAsiaAustraliaAustriaBahamasBangladeshBarbadosBelarusBelgiumBelizeBoliviaBosnia and HerzegovinaBrazilBulgariaBurma/MyanmarCabo VerdeCambodiaCameroonCanadaCaribbeanCentral AmericaChileChinaColombiaCongoCosta RicaCroatiaCubaCzechoslovakiaDenmarkDominicaDominican RepublicEastern AfricaEastern AsiaEastern EuropeEcuadorEgyptEl SalvadorEnglandEritreaEthiopiaEuropeFijiFranceGermanyGhanaGreeceGrenadaGuatemalaGuyanaHaitiHondurasHong KongHungaryIndiaIndonesiaIranIraqIrelandIsraelItalyJamaicaJapanJordanKazakhstanKenyaKoreaKuwaitLaosLatin AmericaLatviaLebanonLiberiaLithuaniaMalaysiaMexicoMicronesiaMiddle AfricaMoldovaMoroccoNepalNetherlandsNicaraguaNigeriaNorth AmericaNorth MacedoniaNorthern AfricaNorthern EuropeNorwayOceaniaPakistanPanamaPeruPhilippinesPolandPortugalRomaniaRussiaSaudi ArabiaScotlandSenegalSerbiaSierra LeoneSingaporeSomaliaSouth AfricaSouth AmericaSouth Central AsiaSouth Eastern AsiaSouthern EuropeSpainSri LankaSt. Vincent and the GrenadinesSudanSwedenSwitzerlandSyriaTaiwanThailandTrinidad and TobagoTurkeyUgandaUkraineUruguayUzbekistanVenezuelaVietnamWest IndiesWestern AfricaWestern AsiaWestern EuropeYemenZaireZimbabweAzores
Burmese
Race
Ancestry
AfghanAfricanAlaska NativeAlaskan AthabascanAlbanianAleutAlsatianAmericanApacheArabArapahoArgentineanArmenianAssyrian/Chaldean/SyriacAustralianAustrianBahamianBangladeshiBarbadianBasqueBelgianBelizeanBermudanBhutaneseBlackfeetBolivianBrazilianBritishBritish West IndianBulgarianBurmeseCajunCambodianCanadianCape VerdeanCarpatho RusynCelticCentral AmericanCentral American IndianCherokeeCheyenneChickasawChileanChineseChippewaChoctawColombianColvilleComancheCosta RicanCreeCreekCroatianCrowCubanCypriotCzechCzechoslovakianDanishDelawareDominicanDutchDutch West IndianEastern EuropeanEcuadorianEgyptianEnglishEstonianEthiopianEuropeanFijianFilipinoFinnishFrenchFrench American IndianFrench CanadianGermanGerman RussianGhanaianGreekGuamanian/ChamorroGuatemalanGuyaneseHaitianHmongHonduranHopiHoumaHungarianIcelanderIndian (Asian)IndonesianInupiatIranianIraqiIrishIroquoisIsraeliItalianJamaicanJapaneseJordanianKenyanKiowaKoreanLaotianLatvianLebaneseLiberianLithuanianLumbeeLuxembourgerMacedonianMalaysianMalteseMarshalleseMenomineeMexicanMexican American IndianMongolianMoroccanNative HawaiianNavajoNepaleseNew ZealanderNicaraguanNigerianNorthern EuropeanNorwegianOkinawanOsageOttawaPaiutePakistaniPalestinianPanamanianParaguayanPennsylvania GermanPeruvianPimaPolishPortuguesePotawatomiPuebloPuerto RicanPuget Sound SalishRomanianRussianSalvadoranSamoanScandinavianScotch-IrishScottishSeminoleSenegaleseSerbianShoshoneSierra LeoneanSiouxSlavicSlovakSloveneSomaliSouth AfricanSouth AmericanSouth American IndianSoviet UnionSpaniardSpanishSpanish AmericanSpanish American IndianSri LankanSubsaharan AfricanSudaneseSwedishSwissSyrianTaiwaneseThaiTlingit-HaidaTohono O'OdhamTonganTrinidadian and TobagonianTsimshianTurkishU.S. Virgin IslanderUgandanUkrainianUruguayanUteVenezuelanVietnameseWelshWest IndianYakamaYaquiYugoslavianYumanYup'ikZimbabwean
Immigration
NonimmigrantsImmigrantsAfghanistanAfricaAlbaniaArgentinaArmeniaAsiaAustraliaAustriaBahamasBangladeshBarbadosBelarusBelgiumBelizeBoliviaBosnia and HerzegovinaBrazilBulgariaBurma/MyanmarCambodiaCameroonCanadaCaribbeanCentral AmericaChileChinaColombiaCongoCosta RicaCroatiaCubaCzechoslovakiaDenmarkDominicaDominican RepublicEastern AfricaEastern AsiaEastern EuropeEcuadorEgyptEl SalvadorEnglandEritreaEthiopiaEuropeFijiFranceGermanyGhanaGreeceGrenadaGuatemalaGuyanaHaitiHondurasHong KongHungaryIndiaIndonesiaIranIraqIrelandIsraelItalyJamaicaJapanJordanKazakhstanKenyaKoreaKuwaitLaosLatin AmericaLatviaLebanonLiberiaLithuaniaMalaysiaMexicoMicronesiaMiddle AfricaMoldovaMoroccoNepalNetherlandsNicaraguaNigeriaNorth AmericaNorth MacedoniaNorthern AfricaNorthern EuropeNorwayOceaniaPakistanPanamaPeruPhilippinesPolandPortugalRomaniaRussiaSaudi ArabiaScotlandSenegalSerbiaSierra LeoneSingaporeSomaliaSouth AfricaSouth AmericaSouth Central AsiaSouth Eastern AsiaSouthern EuropeSpainSri LankaSt. Vincent and the GrenadinesSudanSwedenSwitzerlandSyriaTaiwanThailandTrinidad and TobagoTurkeyUgandaUkraineUruguayUzbekistanVenezuelaVietnamWest IndiesWestern AfricaWestern AsiaWestern EuropeYemenZaireZimbabweAzores
GED/Equivalency
Income
Poverty
Unemployment
Labor Participation
Family Structure
Vehicle Availability
Education Level
Disability

GED/Equivalency Comparison

Immigrants from Cabo Verde

Burmese

Tragic
Exceptional
78.9%
GED/EQUIVALENCY
0.0/ 100
METRIC RATING
330th/ 347
METRIC RANK
88.3%
GED/EQUIVALENCY
99.7/ 100
METRIC RATING
38th/ 347
METRIC RANK

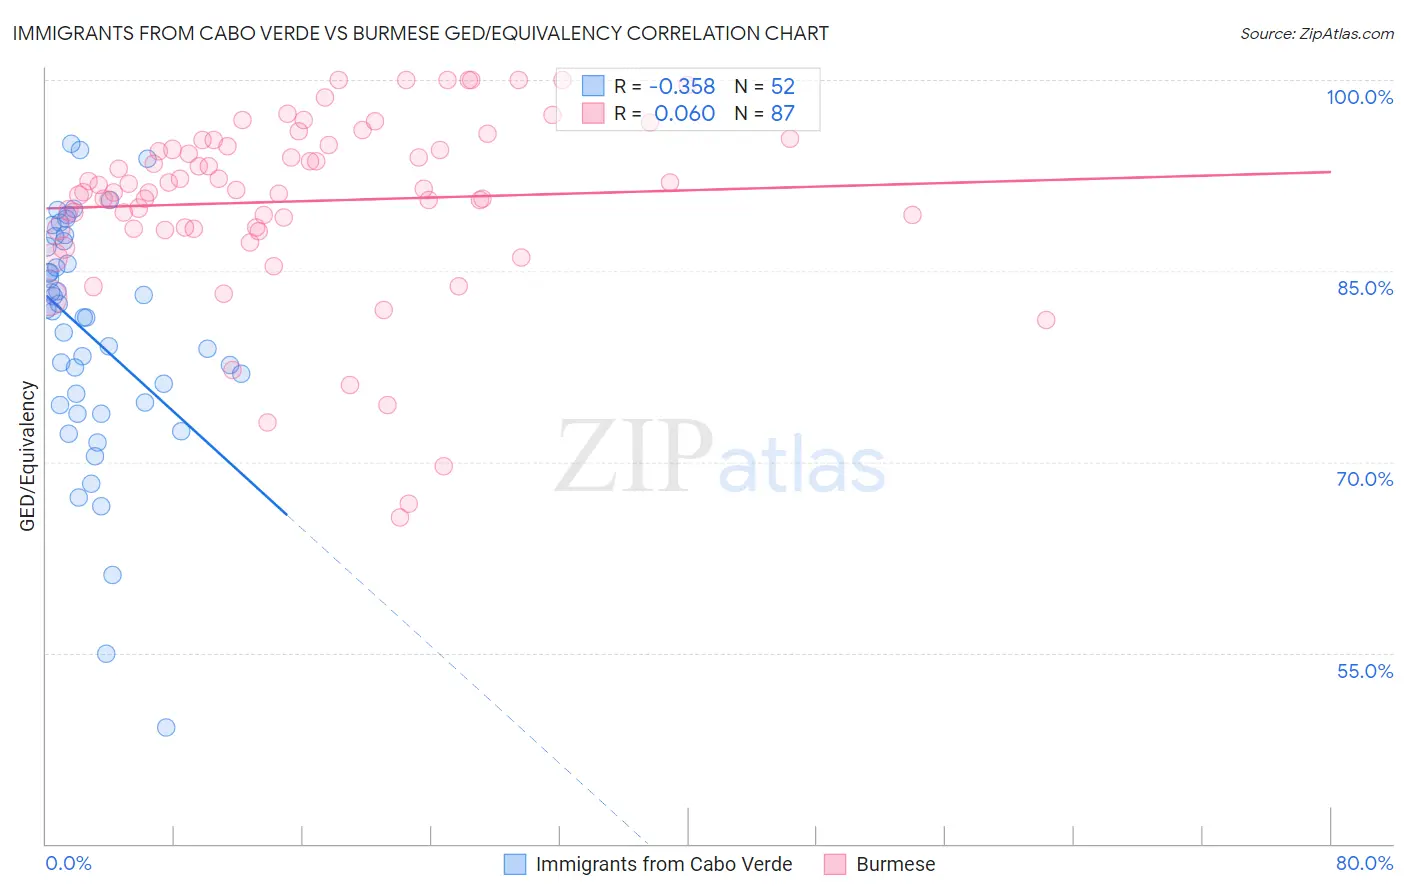
Immigrants from Cabo Verde vs Burmese GED/Equivalency Correlation Chart

The statistical analysis conducted on geographies consisting of 38,158,504 people shows a mild negative correlation between the proportion of Immigrants from Cabo Verde and percentage of population with at least ged/equivalency education in the United States with a correlation coefficient (R) of -0.358 and weighted average of 78.9%. Similarly, the statistical analysis conducted on geographies consisting of 465,408,087 people shows a slight positive correlation between the proportion of Burmese and percentage of population with at least ged/equivalency education in the United States with a correlation coefficient (R) of 0.060 and weighted average of 88.3%, a difference of 11.9%.
Immigrants from Cabo Verde vs Burmese GED/Equivalency

GED/Equivalency Correlation Summary

MeasurementImmigrants from Cabo VerdeBurmese
Minimum49.2%65.6%
Maximum95.0%100.0%
Range45.8%34.4%
Mean79.9%90.5%
Median81.6%91.4%
Interquartile 25% (IQ1)74.6%88.3%
Interquartile 75% (IQ3)87.1%94.9%
Interquartile Range (IQR)12.6%6.6%
Standard Deviation (Sample)9.5%7.2%
Standard Deviation (Population)9.4%7.1%

Similar Demographics by GED/Equivalency

Demographics Similar to Immigrants from Cabo Verde by GED/Equivalency

In terms of ged/equivalency, the demographic groups most similar to Immigrants from Cabo Verde are Dominican (79.1%, a difference of 0.16%), Hispanic or Latino (79.1%, a difference of 0.20%), Immigrants from Honduras (78.7%, a difference of 0.24%), Central American (79.2%, a difference of 0.31%), and Yuman (79.2%, a difference of 0.33%).
DemographicsRating | RankGED/Equivalency
Immigrants | Nicaragua
0.0
/100
|
#323
Tragic
79.9%
Mexican American Indians
0.0
/100
|
#324
Tragic
79.4%
Hondurans
0.0
/100
|
#325
Tragic
79.3%
Yuman
0.0
/100
|
#326
Tragic
79.2%
Central Americans
0.0
/100
|
#327
Tragic
79.2%
Hispanics or Latinos
0.0
/100
|
#328
Tragic
79.1%
Dominicans
0.0
/100
|
#329
Tragic
79.1%
Immigrants | Cabo Verde
0.0
/100
|
#330
Tragic
78.9%
Immigrants | Honduras
0.0
/100
|
#331
Tragic
78.7%
Immigrants | Azores
0.0
/100
|
#332
Tragic
78.7%
Salvadorans
0.0
/100
|
#333
Tragic
78.6%
Guatemalans
0.0
/100
|
#334
Tragic
78.5%
Immigrants | Latin America
0.0
/100
|
#335
Tragic
78.5%
Immigrants | Dominican Republic
0.0
/100
|
#336
Tragic
78.0%
Immigrants | Yemen
0.0
/100
|
#337
Tragic
77.9%

Demographics Similar to Burmese by GED/Equivalency

In terms of ged/equivalency, the demographic groups most similar to Burmese are Immigrants from Austria (88.3%, a difference of 0.030%), Immigrants from Belgium (88.3%, a difference of 0.060%), Immigrants from South Central Asia (88.4%, a difference of 0.080%), Immigrants from Israel (88.2%, a difference of 0.090%), and Immigrants from Sweden (88.4%, a difference of 0.10%).
DemographicsRating | RankGED/Equivalency
Bhutanese
99.8
/100
|
#31
Exceptional
88.4%
Danes
99.8
/100
|
#32
Exceptional
88.4%
Immigrants | Sweden
99.7
/100
|
#33
Exceptional
88.4%
Immigrants | Japan
99.7
/100
|
#34
Exceptional
88.4%
Immigrants | South Central Asia
99.7
/100
|
#35
Exceptional
88.4%
Immigrants | Belgium
99.7
/100
|
#36
Exceptional
88.3%
Immigrants | Austria
99.7
/100
|
#37
Exceptional
88.3%
Burmese
99.7
/100
|
#38
Exceptional
88.3%
Immigrants | Israel
99.6
/100
|
#39
Exceptional
88.2%
Italians
99.6
/100
|
#40
Exceptional
88.2%
Finns
99.6
/100
|
#41
Exceptional
88.2%
Cambodians
99.6
/100
|
#42
Exceptional
88.2%
Immigrants | Scotland
99.6
/100
|
#43
Exceptional
88.2%
Macedonians
99.5
/100
|
#44
Exceptional
88.1%
Czechs
99.5
/100
|
#45
Exceptional
88.1%