Immigrants from Burma/Myanmar vs Mongolian Associate's Degree
COMPARE
Immigrants from Burma/Myanmar
Mongolian
Associate's Degree
Associate's Degree Comparison
Immigrants from Burma/Myanmar
Mongolians
43.7%
ASSOCIATE'S DEGREE
4.3/ 100
METRIC RATING
226th/ 347
METRIC RANK
53.0%
ASSOCIATE'S DEGREE
100.0/ 100
METRIC RATING
38th/ 347
METRIC RANK
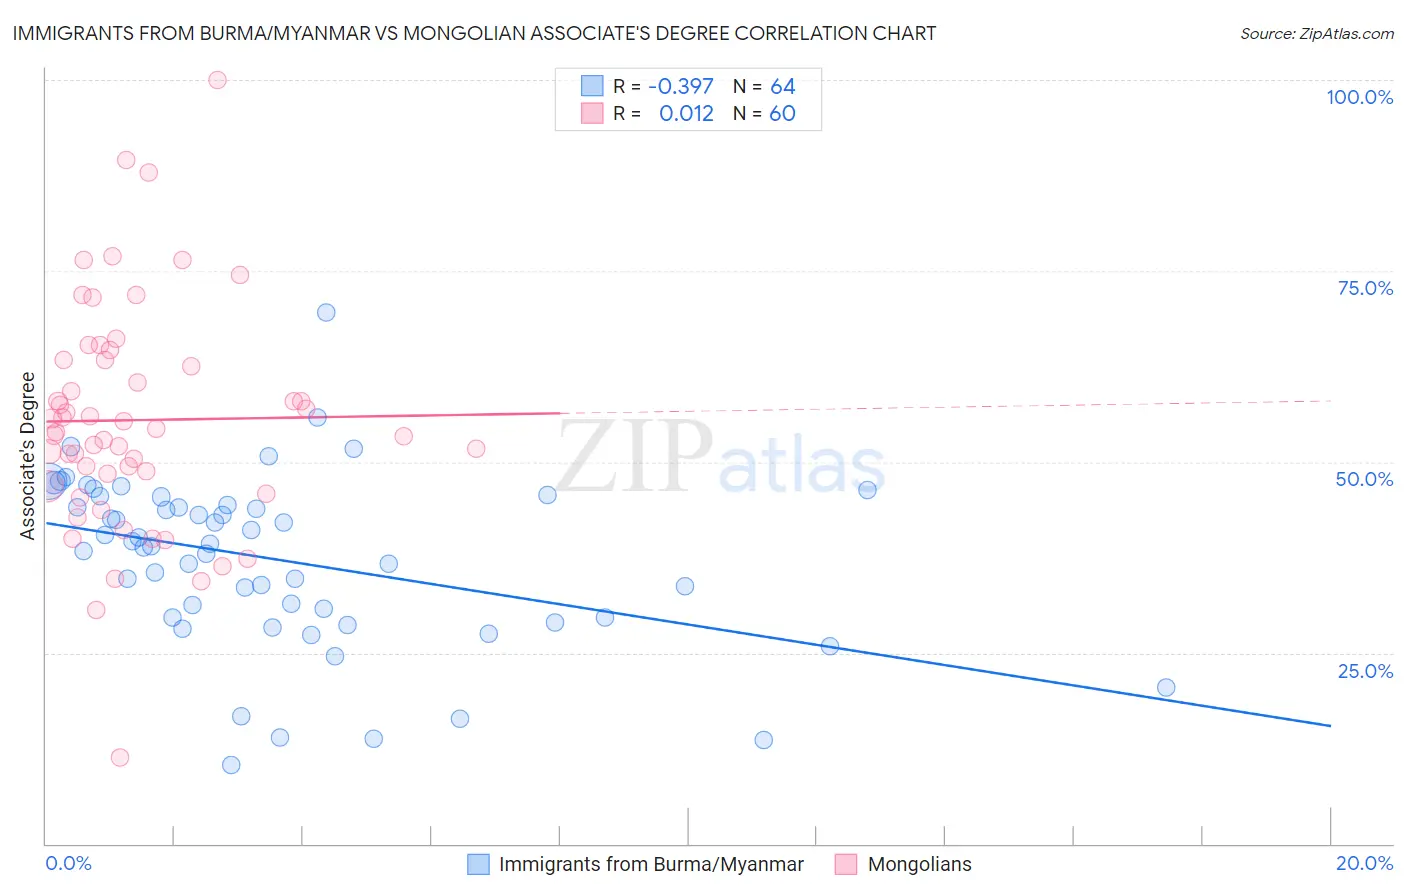
Immigrants from Burma/Myanmar vs Mongolian Associate's Degree Correlation Chart
The statistical analysis conducted on geographies consisting of 172,341,560 people shows a mild negative correlation between the proportion of Immigrants from Burma/Myanmar and percentage of population with at least associate's degree education in the United States with a correlation coefficient (R) of -0.397 and weighted average of 43.7%. Similarly, the statistical analysis conducted on geographies consisting of 140,359,763 people shows no correlation between the proportion of Mongolians and percentage of population with at least associate's degree education in the United States with a correlation coefficient (R) of 0.012 and weighted average of 53.0%, a difference of 21.3%.
Associate's Degree Correlation Summary
| Measurement | Immigrants from Burma/Myanmar | Mongolian |
| Minimum | 10.2% | 11.2% |
| Maximum | 69.5% | 100.0% |
| Range | 59.3% | 88.8% |
| Mean | 37.2% | 55.5% |
| Median | 39.1% | 54.1% |
| Interquartile 25% (IQ1) | 29.7% | 47.6% |
| Interquartile 75% (IQ3) | 44.9% | 63.3% |
| Interquartile Range (IQR) | 15.2% | 15.7% |
| Standard Deviation (Sample) | 11.3% | 15.0% |
| Standard Deviation (Population) | 11.2% | 14.9% |
Similar Demographics by Associate's Degree
Demographics Similar to Immigrants from Burma/Myanmar by Associate's Degree
In terms of associate's degree, the demographic groups most similar to Immigrants from Burma/Myanmar are Trinidadian and Tobagonian (43.6%, a difference of 0.17%), Guamanian/Chamorro (43.8%, a difference of 0.22%), West Indian (43.8%, a difference of 0.37%), Subsaharan African (43.9%, a difference of 0.51%), and Barbadian (43.9%, a difference of 0.61%).
| Demographics | Rating | Rank | Associate's Degree |
| Whites/Caucasians | 7.5 /100 | #219 | Tragic 44.2% |
| Portuguese | 7.2 /100 | #220 | Tragic 44.1% |
| Immigrants | Western Africa | 6.6 /100 | #221 | Tragic 44.1% |
| Barbadians | 5.8 /100 | #222 | Tragic 43.9% |
| Sub-Saharan Africans | 5.5 /100 | #223 | Tragic 43.9% |
| West Indians | 5.2 /100 | #224 | Tragic 43.8% |
| Guamanians/Chamorros | 4.8 /100 | #225 | Tragic 43.8% |
| Immigrants | Burma/Myanmar | 4.3 /100 | #226 | Tragic 43.7% |
| Trinidadians and Tobagonians | 4.0 /100 | #227 | Tragic 43.6% |
| Hmong | 3.2 /100 | #228 | Tragic 43.4% |
| Immigrants | Trinidad and Tobago | 3.0 /100 | #229 | Tragic 43.3% |
| Immigrants | Barbados | 2.9 /100 | #230 | Tragic 43.3% |
| Liberians | 2.9 /100 | #231 | Tragic 43.3% |
| Native Hawaiians | 2.3 /100 | #232 | Tragic 43.1% |
| Tongans | 2.2 /100 | #233 | Tragic 43.0% |
Demographics Similar to Mongolians by Associate's Degree
In terms of associate's degree, the demographic groups most similar to Mongolians are Immigrants from Denmark (53.1%, a difference of 0.16%), Immigrants from Russia (53.1%, a difference of 0.25%), Immigrants from Belarus (52.8%, a difference of 0.29%), Immigrants from Latvia (52.8%, a difference of 0.36%), and Russian (53.2%, a difference of 0.53%).
| Demographics | Rating | Rank | Associate's Degree |
| Immigrants | Northern Europe | 100.0 /100 | #31 | Exceptional 53.5% |
| Immigrants | Turkey | 100.0 /100 | #32 | Exceptional 53.4% |
| Israelis | 100.0 /100 | #33 | Exceptional 53.4% |
| Bulgarians | 100.0 /100 | #34 | Exceptional 53.3% |
| Russians | 100.0 /100 | #35 | Exceptional 53.2% |
| Immigrants | Russia | 100.0 /100 | #36 | Exceptional 53.1% |
| Immigrants | Denmark | 100.0 /100 | #37 | Exceptional 53.1% |
| Mongolians | 100.0 /100 | #38 | Exceptional 53.0% |
| Immigrants | Belarus | 99.9 /100 | #39 | Exceptional 52.8% |
| Immigrants | Latvia | 99.9 /100 | #40 | Exceptional 52.8% |
| Immigrants | Saudi Arabia | 99.9 /100 | #41 | Exceptional 52.6% |
| Immigrants | Malaysia | 99.9 /100 | #42 | Exceptional 52.5% |
| Immigrants | South Africa | 99.9 /100 | #43 | Exceptional 52.5% |
| Estonians | 99.9 /100 | #44 | Exceptional 52.5% |
| Immigrants | Lithuania | 99.9 /100 | #45 | Exceptional 52.4% |