Immigrants from Burma/Myanmar vs Immigrants from Europe No Schooling Completed

COMPARE

Immigrants from Burma/Myanmar
Race
Ancestry
AfghanAfricanAlaska NativeAlaskan AthabascanAlbanianAleutAlsatianAmericanApacheArabArapahoArgentineanArmenianAssyrian/Chaldean/SyriacAustralianAustrianBahamianBangladeshiBarbadianBasqueBelgianBelizeanBermudanBhutaneseBlackfeetBolivianBrazilianBritishBritish West IndianBulgarianBurmeseCajunCambodianCanadianCape VerdeanCarpatho RusynCelticCentral AmericanCentral American IndianCherokeeCheyenneChickasawChileanChineseChippewaChoctawColombianColvilleComancheCosta RicanCreeCreekCroatianCrowCubanCypriotCzechCzechoslovakianDanishDelawareDominicanDutchDutch West IndianEastern EuropeanEcuadorianEgyptianEnglishEstonianEthiopianEuropeanFijianFilipinoFinnishFrenchFrench American IndianFrench CanadianGermanGerman RussianGhanaianGreekGuamanian/ChamorroGuatemalanGuyaneseHaitianHmongHonduranHopiHoumaHungarianIcelanderIndian (Asian)IndonesianInupiatIranianIraqiIrishIroquoisIsraeliItalianJamaicanJapaneseJordanianKenyanKiowaKoreanLaotianLatvianLebaneseLiberianLithuanianLumbeeLuxembourgerMacedonianMalaysianMalteseMarshalleseMenomineeMexicanMexican American IndianMongolianMoroccanNative HawaiianNavajoNepaleseNew ZealanderNicaraguanNigerianNorthern EuropeanNorwegianOkinawanOsageOttawaPaiutePakistaniPalestinianPanamanianParaguayanPennsylvania GermanPeruvianPimaPolishPortuguesePotawatomiPuebloPuerto RicanPuget Sound SalishRomanianRussianSalvadoranSamoanScandinavianScotch-IrishScottishSeminoleSenegaleseSerbianShoshoneSierra LeoneanSiouxSlavicSlovakSloveneSomaliSouth AfricanSouth AmericanSouth American IndianSoviet UnionSpaniardSpanishSpanish AmericanSpanish American IndianSri LankanSubsaharan AfricanSudaneseSwedishSwissSyrianTaiwaneseThaiTlingit-HaidaTohono O'OdhamTonganTrinidadian and TobagonianTsimshianTurkishU.S. Virgin IslanderUgandanUkrainianUruguayanUteVenezuelanVietnameseWelshWest IndianYakamaYaquiYugoslavianYumanYup'ikZimbabwean
Immigration
NonimmigrantsImmigrantsAfghanistanAfricaAlbaniaArgentinaArmeniaAsiaAustraliaAustriaBahamasBangladeshBarbadosBelarusBelgiumBelizeBoliviaBosnia and HerzegovinaBrazilBulgariaBurma/MyanmarCabo VerdeCambodiaCameroonCanadaCaribbeanCentral AmericaChileChinaColombiaCongoCosta RicaCroatiaCubaCzechoslovakiaDenmarkDominicaDominican RepublicEastern AfricaEastern AsiaEastern EuropeEcuadorEgyptEl SalvadorEnglandEritreaEthiopiaFijiFranceGermanyGhanaGreeceGrenadaGuatemalaGuyanaHaitiHondurasHong KongHungaryIndiaIndonesiaIranIraqIrelandIsraelItalyJamaicaJapanJordanKazakhstanKenyaKoreaKuwaitLaosLatin AmericaLatviaLebanonLiberiaLithuaniaMalaysiaMexicoMicronesiaMiddle AfricaMoldovaMoroccoNepalNetherlandsNicaraguaNigeriaNorth AmericaNorth MacedoniaNorthern AfricaNorthern EuropeNorwayOceaniaPakistanPanamaPeruPhilippinesPolandPortugalRomaniaRussiaSaudi ArabiaScotlandSenegalSerbiaSierra LeoneSingaporeSomaliaSouth AfricaSouth AmericaSouth Central AsiaSouth Eastern AsiaSouthern EuropeSpainSri LankaSt. Vincent and the GrenadinesSudanSwedenSwitzerlandSyriaTaiwanThailandTrinidad and TobagoTurkeyUgandaUkraineUruguayUzbekistanVenezuelaVietnamWest IndiesWestern AfricaWestern AsiaWestern EuropeYemenZaireZimbabweAzores
Immigrants from Europe
Race
Ancestry
AfghanAfricanAlaska NativeAlaskan AthabascanAlbanianAleutAlsatianAmericanApacheArabArapahoArgentineanArmenianAssyrian/Chaldean/SyriacAustralianAustrianBahamianBangladeshiBarbadianBasqueBelgianBelizeanBermudanBhutaneseBlackfeetBolivianBrazilianBritishBritish West IndianBulgarianBurmeseCajunCambodianCanadianCape VerdeanCarpatho RusynCelticCentral AmericanCentral American IndianCherokeeCheyenneChickasawChileanChineseChippewaChoctawColombianColvilleComancheCosta RicanCreeCreekCroatianCrowCubanCypriotCzechCzechoslovakianDanishDelawareDominicanDutchDutch West IndianEastern EuropeanEcuadorianEgyptianEnglishEstonianEthiopianEuropeanFijianFilipinoFinnishFrenchFrench American IndianFrench CanadianGermanGerman RussianGhanaianGreekGuamanian/ChamorroGuatemalanGuyaneseHaitianHmongHonduranHopiHoumaHungarianIcelanderIndian (Asian)IndonesianInupiatIranianIraqiIrishIroquoisIsraeliItalianJamaicanJapaneseJordanianKenyanKiowaKoreanLaotianLatvianLebaneseLiberianLithuanianLumbeeLuxembourgerMacedonianMalaysianMalteseMarshalleseMenomineeMexicanMexican American IndianMongolianMoroccanNative HawaiianNavajoNepaleseNew ZealanderNicaraguanNigerianNorthern EuropeanNorwegianOkinawanOsageOttawaPaiutePakistaniPalestinianPanamanianParaguayanPennsylvania GermanPeruvianPimaPolishPortuguesePotawatomiPuebloPuerto RicanPuget Sound SalishRomanianRussianSalvadoranSamoanScandinavianScotch-IrishScottishSeminoleSenegaleseSerbianShoshoneSierra LeoneanSiouxSlavicSlovakSloveneSomaliSouth AfricanSouth AmericanSouth American IndianSoviet UnionSpaniardSpanishSpanish AmericanSpanish American IndianSri LankanSubsaharan AfricanSudaneseSwedishSwissSyrianTaiwaneseThaiTlingit-HaidaTohono O'OdhamTonganTrinidadian and TobagonianTsimshianTurkishU.S. Virgin IslanderUgandanUkrainianUruguayanUteVenezuelanVietnameseWelshWest IndianYakamaYaquiYugoslavianYumanYup'ikZimbabwean
Immigration
NonimmigrantsImmigrantsAfghanistanAfricaAlbaniaArgentinaArmeniaAsiaAustraliaAustriaBahamasBangladeshBarbadosBelarusBelgiumBelizeBoliviaBosnia and HerzegovinaBrazilBulgariaCabo VerdeCambodiaCameroonCanadaCaribbeanCentral AmericaChileChinaColombiaCongoCosta RicaCroatiaCubaCzechoslovakiaDenmarkDominicaDominican RepublicEastern AfricaEastern AsiaEastern EuropeEcuadorEgyptEl SalvadorEnglandEritreaEthiopiaEuropeFijiFranceGermanyGhanaGreeceGrenadaGuatemalaGuyanaHaitiHondurasHong KongHungaryIndiaIndonesiaIranIraqIrelandIsraelItalyJamaicaJapanJordanKazakhstanKenyaKoreaKuwaitLaosLatin AmericaLatviaLebanonLiberiaLithuaniaMalaysiaMexicoMicronesiaMiddle AfricaMoldovaMoroccoNepalNetherlandsNicaraguaNigeriaNorth AmericaNorth MacedoniaNorthern AfricaNorthern EuropeNorwayOceaniaPakistanPanamaPeruPhilippinesPolandPortugalRomaniaRussiaSaudi ArabiaScotlandSenegalSerbiaSierra LeoneSingaporeSomaliaSouth AfricaSouth AmericaSouth Central AsiaSouth Eastern AsiaSouthern EuropeSpainSri LankaSt. Vincent and the GrenadinesSudanSwedenSwitzerlandSyriaTaiwanThailandTrinidad and TobagoTurkeyUgandaUkraineUruguayUzbekistanVenezuelaVietnamWest IndiesWestern AfricaWestern AsiaWestern EuropeYemenZaireZimbabweAzores
No Schooling Completed
Income
Poverty
Unemployment
Labor Participation
Family Structure
Vehicle Availability
Education Level
Disability

No Schooling Completed Comparison

Immigrants from Burma/Myanmar

Immigrants from Europe

Tragic
Exceptional
3.1%
NO SCHOOLING COMPLETED
0.0/ 100
METRIC RATING
319th/ 347
METRIC RANK
1.9%
NO SCHOOLING COMPLETED
93.7/ 100
METRIC RATING
125th/ 347
METRIC RANK

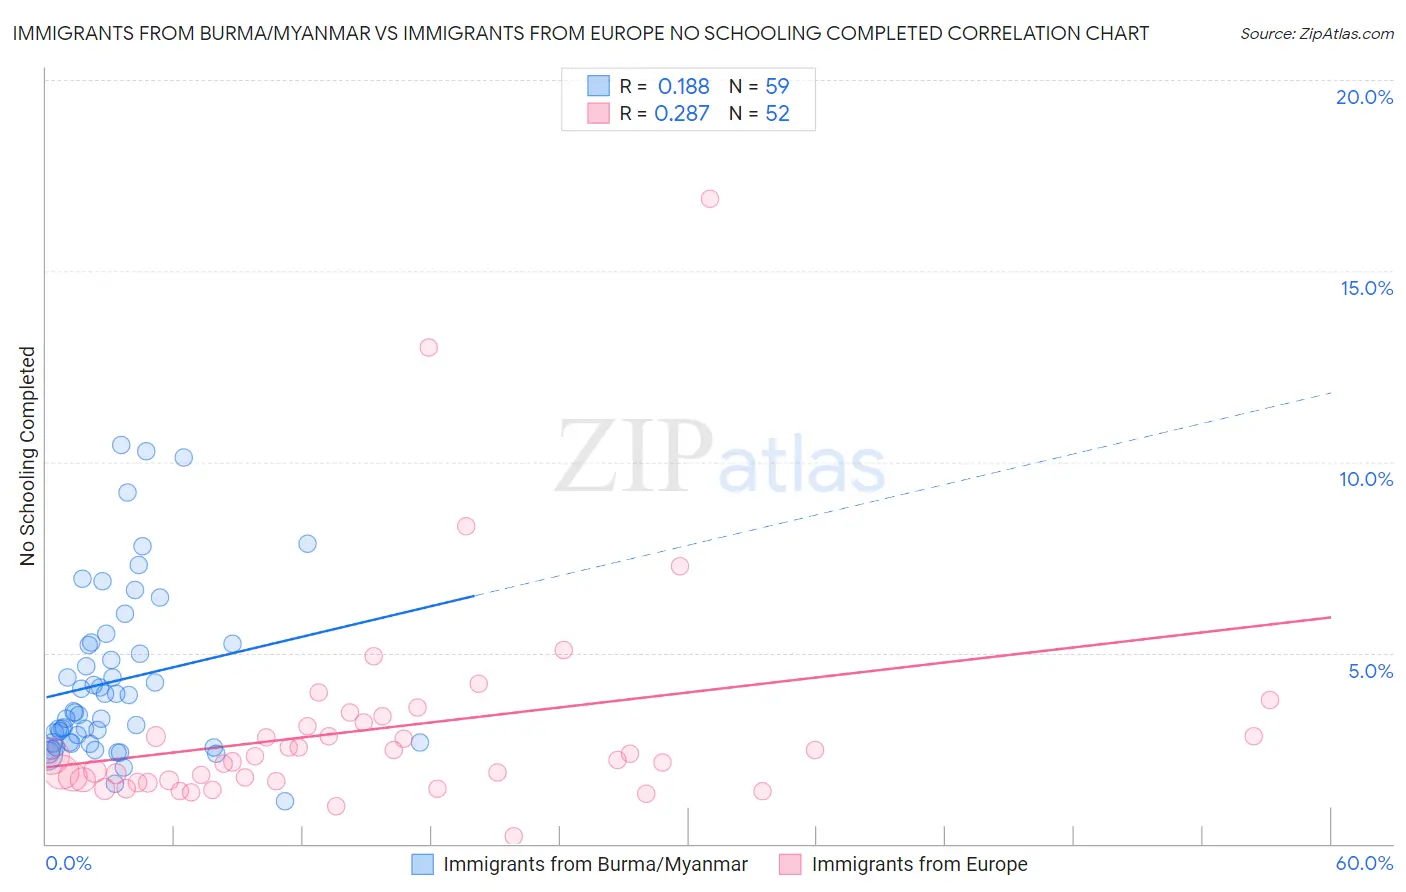
Immigrants from Burma/Myanmar vs Immigrants from Europe No Schooling Completed Correlation Chart

The statistical analysis conducted on geographies consisting of 171,802,703 people shows a poor positive correlation between the proportion of Immigrants from Burma/Myanmar and percentage of population with no schooling in the United States with a correlation coefficient (R) of 0.188 and weighted average of 3.1%. Similarly, the statistical analysis conducted on geographies consisting of 533,582,074 people shows a weak positive correlation between the proportion of Immigrants from Europe and percentage of population with no schooling in the United States with a correlation coefficient (R) of 0.287 and weighted average of 1.9%, a difference of 65.3%.
Immigrants from Burma/Myanmar vs Immigrants from Europe No Schooling Completed

No Schooling Completed Correlation Summary

MeasurementImmigrants from Burma/MyanmarImmigrants from Europe
Minimum1.1%0.21%
Maximum10.4%16.9%
Range9.3%16.7%
Mean4.3%3.0%
Median3.4%2.2%
Interquartile 25% (IQ1)2.6%1.6%
Interquartile 75% (IQ3)5.2%3.1%
Interquartile Range (IQR)2.6%1.5%
Standard Deviation (Sample)2.2%2.8%
Standard Deviation (Population)2.2%2.8%

Similar Demographics by No Schooling Completed

Demographics Similar to Immigrants from Burma/Myanmar by No Schooling Completed

In terms of no schooling completed, the demographic groups most similar to Immigrants from Burma/Myanmar are Immigrants from Bangladesh (3.1%, a difference of 0.040%), Immigrants from Laos (3.1%, a difference of 0.15%), Immigrants from Guyana (3.1%, a difference of 0.74%), Immigrants from Honduras (3.2%, a difference of 0.83%), and Vietnamese (3.2%, a difference of 1.0%).
DemographicsRating | RankNo Schooling Completed
Sri Lankans
0.0
/100
|
#312
Tragic
3.0%
Hondurans
0.0
/100
|
#313
Tragic
3.1%
Immigrants | Belize
0.0
/100
|
#314
Tragic
3.1%
Immigrants | Nicaragua
0.0
/100
|
#315
Tragic
3.1%
Immigrants | Ecuador
0.0
/100
|
#316
Tragic
3.1%
Cape Verdeans
0.0
/100
|
#317
Tragic
3.1%
Immigrants | Guyana
0.0
/100
|
#318
Tragic
3.1%
Immigrants | Burma/Myanmar
0.0
/100
|
#319
Tragic
3.1%
Immigrants | Bangladesh
0.0
/100
|
#320
Tragic
3.1%
Immigrants | Laos
0.0
/100
|
#321
Tragic
3.1%
Immigrants | Honduras
0.0
/100
|
#322
Tragic
3.2%
Vietnamese
0.0
/100
|
#323
Tragic
3.2%
Mexican American Indians
0.0
/100
|
#324
Tragic
3.2%
Dominicans
0.0
/100
|
#325
Tragic
3.2%
Indonesians
0.0
/100
|
#326
Tragic
3.2%

Demographics Similar to Immigrants from Europe by No Schooling Completed

In terms of no schooling completed, the demographic groups most similar to Immigrants from Europe are Cambodian (1.9%, a difference of 0.090%), Immigrants from Kuwait (1.9%, a difference of 0.17%), Cree (1.9%, a difference of 0.53%), Immigrants from Croatia (1.9%, a difference of 0.56%), and Immigrants from Bulgaria (1.9%, a difference of 0.63%).
DemographicsRating | RankNo Schooling Completed
Spanish
95.5
/100
|
#118
Exceptional
1.9%
Iroquois
95.1
/100
|
#119
Exceptional
1.9%
Immigrants | Bulgaria
94.6
/100
|
#120
Exceptional
1.9%
Immigrants | Croatia
94.5
/100
|
#121
Exceptional
1.9%
Cree
94.5
/100
|
#122
Exceptional
1.9%
Immigrants | Kuwait
93.9
/100
|
#123
Exceptional
1.9%
Cambodians
93.8
/100
|
#124
Exceptional
1.9%
Immigrants | Europe
93.7
/100
|
#125
Exceptional
1.9%
Immigrants | Romania
92.6
/100
|
#126
Exceptional
1.9%
Israelis
92.4
/100
|
#127
Exceptional
1.9%
Spaniards
92.3
/100
|
#128
Exceptional
1.9%
Seminole
92.0
/100
|
#129
Exceptional
1.9%
Palestinians
91.8
/100
|
#130
Exceptional
1.9%
Immigrants | Hungary
91.6
/100
|
#131
Exceptional
1.9%
Colville
90.4
/100
|
#132
Exceptional
1.9%